Water Quality
Methods 5.0
Introduction
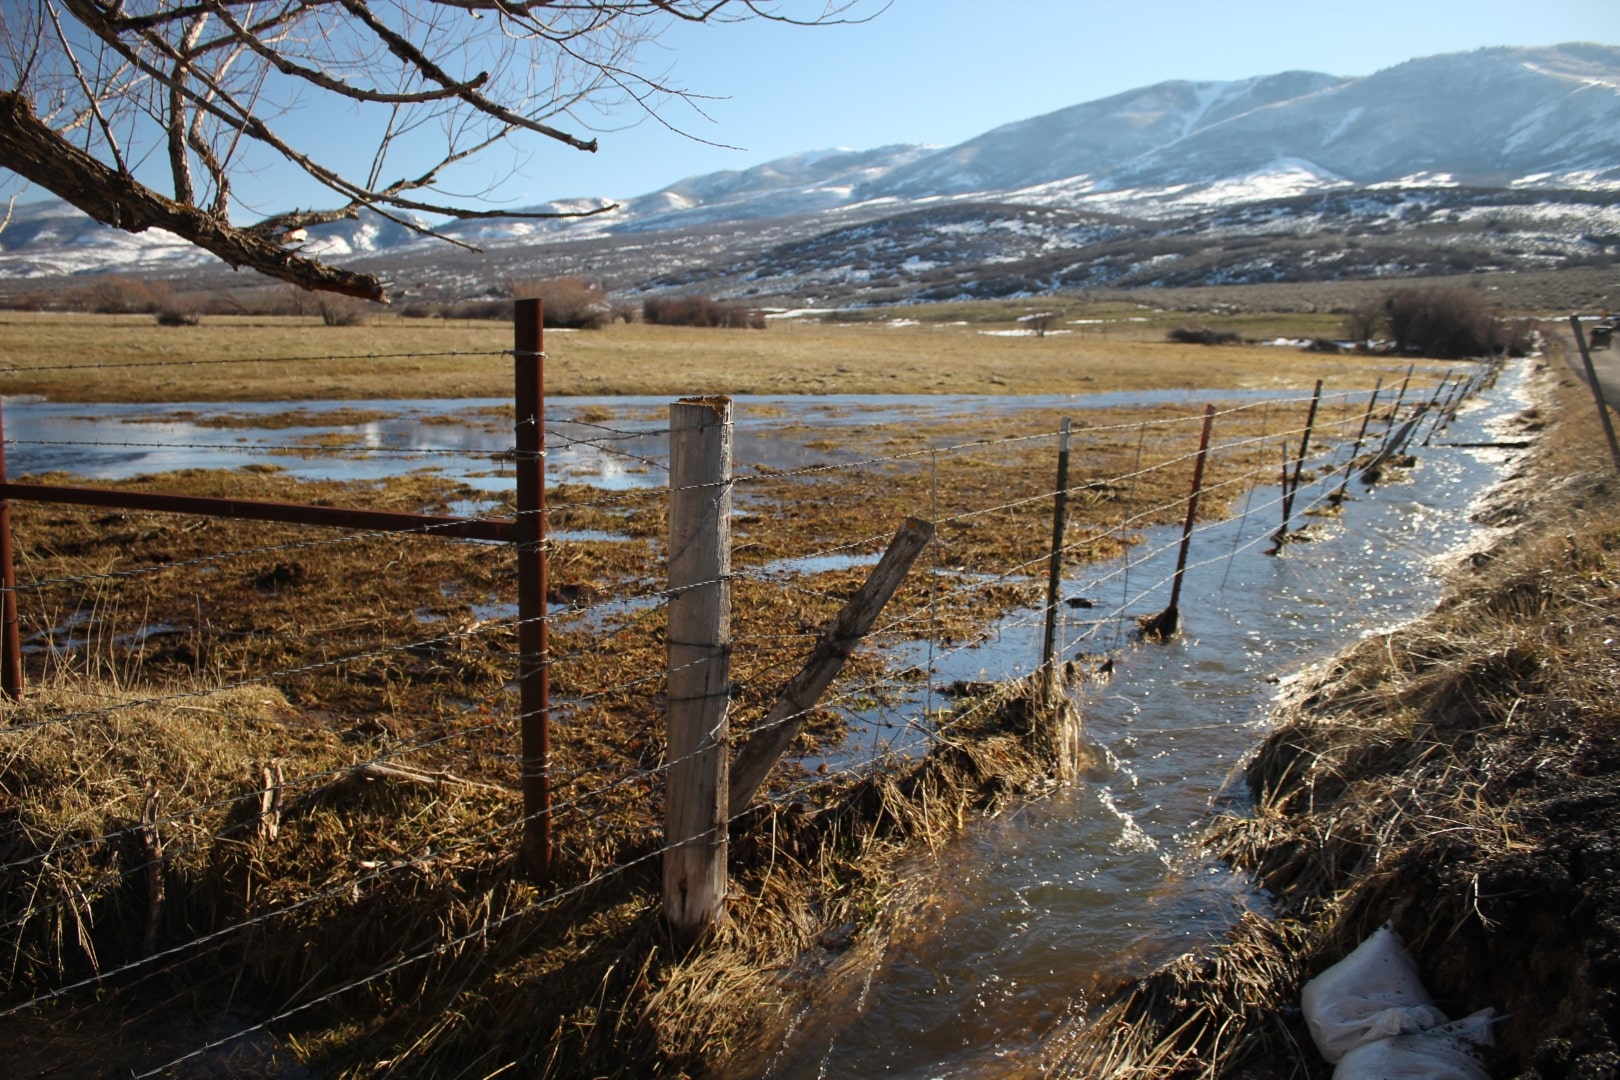
When water leaves the farm field, it can carry away soil and crop inputs resulting in lost investments, reduced yields, and negative impacts on water quality. One concern is when surface waters1 or groundwaters become contaminated with excessive amounts of plant nutrients from the field, such as compounds containing nitrogen (N) and phosphorus (P). These nutrients can move from the farm land to nearby waters through surface pathways (e.g. runoff) and subsurface pathways (e.g. leaching). In groundwaters, nutrients and contaminants can lead to health concerns for consumers2 of well water. In surface waters, high N and P loads contribute to eutrophication which degrades water quality directly due to toxic algal blooms, increased turbidity, and shifts in aquatic species (Foy 2005; Carpenter et al. 1998), which in turn increase costs to water treatment and negatively impact fishing and aquaculture industries.
1 Streams, lakes, reservoirs, etc.
2 Groundwater supplies drinking water to the majority of people in rural agricultural communities. Nitrates, for example, can lead to serious health concerns.
Some field sites are more prone to nutrient loss than others. Sustainability projects need to be able to assess this inherent vulnerability and understand how different conservation practices can enhance water quality.
Water Quality Indicator
Number of pathways mitigated (total possible: 4/4)
The Water Quality indicator for Field to Market is based on the Stewardship Tool for Environmental Performance (STEP) by USDA NRCS. The Fieldprint Platform uses STEP for site-specific metrics that indicate the likelihood of losing N and P and the likelihood that field-level management practices are mitigating potential N and P losses.
Background and Development
STEP is the water quality component of the NRCS Resource Stewardship Evaluation Tool (RSET) program. The calculations, thresholds, and qualitative scores in STEP were developed out of a series of national modeling exercises using Conservation Effects Assessment Project3 cropland reports.
3 CEAP is an ongoing assessment of water quality and conservation practice adoption that applies process-based models (APEX and SWAT) based on detailed survey results from the National Resources Inventory.
The nutrient management component of STEP was adopted by Field to Market in 2021 as the basis for the Water Quality indicator, replacing the USDA Water Quality Index previously used since 2011. The RSET implementation of STEP was chosen in part for being more robust and complex than the simplified version included in the NRCS Conservation Application Ranking Tool (CART). The pesticide and sediment loss components of STEP were not included in the 2021 implementation. Sediment loss is presented through the Soil Conservation metrics, and the technical working group on pesticides found that more time was needed to decide if or how to implement the STEP pesticide component based on WinPST.
Like the Soil Conservation and Soil Carbon indicators, the Fieldprint Platform accesses USDA model and data services through a backend API integration to the Cloud Services Integration Platform (CSIP), a model-as-a-service framework hosted by the Object Modeling System Lab at Colorado State University.
Method
The four nutrient loss pathways included in STEP are:
- N lost in surface runoff
- N lost to subsurface leaching
- Surface, total P loss
- Subsurface, soluble P loss
For each of those four pathways, a field receives three scores:
- Field Sensitivity Score (FSS), or Mitigation Threshold
- site-specific rating of sensitivity/vulnerability to nutrient loss along that pathway
- determines the threshold for minimum mitigation points needed
- based on field location, climate zone, soil properties and topography
- Risk Mitigation Score (RMS)
- indicates how much credit field-level management practices had in terms of nutrient loss mitigation
- Ratio of Mitigation:Threshold
ratios > 1 indicate that nutrient losses were likely mitigated
ratios < 1 indicate that practices were likely insufficient to mitigate nutrient losses
The final metric score is presented in four parts, indicating for each pathway whether the mitigation score exceeds the sensitivity score. Mitigating 4 of 4 pathways is the maximum achievable result.
Step 1: Field Sensitivity
As noted above, each field has inherent properties that influence how likely it is to lose nutrients. These properties include soil leaching potential, soil runoff potential, rainfall intensity, and irrigation status. For fields with diverse soils, STEP conducts an area-weighting of the major soils present to determine the soil leaching and runoff potential across the field as a whole unit.
The Field Sensitivity Score (FSS) rates the field into one of 16 vulnerability categories based on a 4x4 matrix according to the nutrient loss pathway (see NRCS documentation for detail). This rating determine the mitigation threshold, or number of conservation practice points required to reduce the likelihood of nutrient loss. For example,
| Soil Runoff Vulnerability | R Factor ≤50 | >50-150 | >150-250 | >250 |
|---|---|---|---|---|
| High | 35 | 65 | 85 | 100 |
| Moderately High | 30 | 35 | 65 | 85 |
| Moderate | 30 | 30 | 35 | 65 |
| Low | 25 | 30 | 30 | 35 |
These scores may be different for each nutrient loss pathway. The points assigned to specific practices were developed by NRCS staff, informed by the CEAP model results and additional modeling analyses with CEAP data. The points are crop system specific. The goal of NRCS was that STEP planning thresholds met the national CEAP contaminant loss thresholds at least 80% of the time.
The site vulnerability and sensitivity rating occur automatically in the background of the Fieldprint Calculator using user-supplied information on field boundaries to access soil and weather databases and user-supplied information on irrigation management.
Step 2: Risk Mitigation
The second phase of STEP calculations evaluates field practices (crop rotation, tillage, irrigation, nutrient management) to determine the risk mitigation achieved. STEP evaluates a full rotation (typically over multiple years), including any fallow periods or winter cover crops, and requires management data for each crop interval in the rotation period.
The Risk Mitigation Score accumulates credit points from multiple management categories:
Residue/Tillage Management
The timing and level of tillage is used to determine the amount of residue on the field, which affects how rainfall hits the soil and how water flows over the surface.
Conservation Practices
Practices such as cover cropping, installing buffer or filter strips, or drainage management can all contribute mitigation credits depending on practice effectiveness. Cover crops, for example, add points because they are assumed to reduce erosion and capture leachable nutrients.
Nutrient Management
Rate: credit for nutrient application ratios closer to crop removal. Also considers if the first N application was less than 40 lb/ac, the first P application was less than 25 lb/ac, and if the applied P is intended to last for multiple crop intervals.
Timing: credit for applications closer to key crop uptake dates. Also accounts for split applications. For example, applications within 7-21 days of spring planting receive more points than fall applications.
Form: credit for enhanced efficiency fertilizers.
Placement: credit for side-banding or for injection/incorporation below the surface instead of broadcasting on the surface, and for precision technologies like variable rate.
Soil Testing
Soil test P levels impact mitigation scores. For example, if soil test P levels are not High or Very High, two years of P may be applied at one time at a rate based on two years of crop removal.
| P Application Ratio | Excessive/Very High | High (Optimum) | Medium | Low | No Test |
|---|---|---|---|---|---|
| No P application | 15 | 20 | 15 | 0 | 0 |
| ≤ 1.0 | -10 | 15 | 20 | 15 | -10 |
| ≤ 1.2 | -30 | 10 | 15 | 20 | -30 |
| ≤ 1.4 | -50 | 0 | 10 | 15 | -50 |
| > 1.4 | -50 | 0 | 0 | 0 | -50 |
Step 3: Evaluate the Ratio
The ratio of the two scores from steps 1 and 2 indicate whether nutrient losses were likely mitigated by conservation practices. As there are four pathways in STEP, each pathway gets a ratio score.
\[ Ratio = \frac{RMS}{FSS} \]
| Loss Pathway | Sensitivity Rating | Threshold | Risk Mitigation | Ratio |
|---|---|---|---|---|
| Total P | Moderate | 45 | 46 | 1.02 |
| Soluble P | Moderately High | 50 | 48 | 0.96 |
| Surface N | Low | 30 | 37 | 1.23 |
| Subsurface N | High | 65 | 53 | 0.82 |
In this example, 50% of pathways were adequately mitigated.
Interpreting Results
When a mitigation score exceeds the sensitivity-based threshold for a given pathway (i.e. ratio > 1), this should be interpreted to mean the management practices were likely adequate to mitigate nutrient loss. It is important to note that the thresholds should not be considered desirable or sustainable levels of nutrient loss, but rather a reflection of site-specific vulnerability to nutrient loss.
The key metric for the Water Quality Indicator is number of pathways mitigated. The maximum possible score is 4/4. The Fieldprint analysis results page and project reports show that key metric, but also include tables with the complete breakdown of site sensitivity, practice credits achieved, and mitigation ratios for each pathway.
Limitations and Future Considerations
The NRCS documentation emphasizes that it uses the CEAP contaminant thresholds as a general target to help define the STEP planning thresholds as a “reasonable level of planning” based on site-specific loss potential. Across all fields and cropping systems, nutrient loss predictions for a field may be significantly more or less than the CEAP thresholds used to check the reasonableness of the STEP thresholds. Likewise, actual losses can differ significantly from the predicted losses.
As STEP does not dynamically model a field or provide a quantitative estimate of the amount of nutrient loss occurring, the Field to Market is exploring a path towards leveraging the capabilities of the SWAT+ model to provide nutrient loss predictions. In collaboration with CSU, the Fieldprint Platform connects to a SWAT+ model cloud service for the purposes of soil carbon modeling. This SWAT+ integration could provide new quantitative outputs to support the Water Quality indicator.