Soil Conservation
Methods 5.0
Introduction: The Importance of Soil Conservation
Soil erosion represents one of the most significant threats to sustainable agriculture (Montgomery 2007; Pimentel and Burgess 2013). When topsoil is lost through erosion, farmland loses its most productive layer, which is rich in organic matter, nutrients, and biological activity. This loss directly impacts crop productivity, increases the need for inputs like fertilizer, and reduces the land’s resilience to drought and other extreme weather events. Beyond the farm boundary, eroded soil can carry excess nutrients and compounds into waterways, contributing to problems such as sedimentation and algal blooms.
Two major types of erosion affect agricultural land. Water erosion occurs when rainfall and surface runoff dislodge and remove soil particles from the field. This process is particularly prevalent in regions with intense rainfall events and on sloping landscapes. Wind erosion occurs when wind frictional forces lift and transport unprotected soil particles across the landscape. This is most common in drier regions with exposed soils and limited vegetative cover. While both types of erosion are influenced by climate, soil properties, topography, and management practices, they operate through different physical processes and require different models to predict accurately.
The Fieldprint Calculator’s Soil Conservation metric helps farmers and their conservation partners understand their field-specific erosion levels and identify opportunities to reduce soil loss through alternative management practices. Behind this metric are two advanced, science-based models developed by USDA scientists and researchers in the Agricultural Research Service (ARS) and Natural Resources Conservation Service (NRCS): the Water Erosion Prediction Project (WEPP) and the Wind Erosion Prediction System (WEPS). Together, these models provide Fieldprint users a comprehensive assessment of total soil loss from a field in a growing season.
Overview of Soil Erosion Models
Historical Context
Prior to WEPP and WEPS, erosion prediction relied primarily on the Universal Soil Loss Equation (USLE) and its revised version (RUSLE). These empirical models were based on statistical relationships derived from thousands of plot-years of data collection. While groundbreaking at the time, they had limitations in predicting erosion across diverse landscapes and management systems.
WEPP was officially initiated in 1985 to develop next-generation water erosion prediction technology for use by federal agencies involved in soil and water conservation (D. C. Flanagan, E. Gilley, and G. Franti 2007) . Similarly, WEPS was developed to address deficiencies in the empirical Wind Erosion Equation (WEQ), which had been widely used since the 1960s (Wagner 2013).
Process-Based
Unlike their empirical predecessors, WEPP and WEPS are process-based models. This means they simulate the actual physical processes involved in erosion, rather than relying solely on statistical relationships. These models track weather conditions, water movement through soil, plant growth stages, residue decomposition, soil consolidation after tillage, and the physical detachment and transport of soil particles. By modeling these fundamental processes on a daily time-step, they can predict erosion under a wide range of conditions and management scenarios. For example, they can simulate how a rainstorm affects a newly tilled field differently than the same storm would impact a field with established crop cover. They also capture how management decisions influence erosion, such as how residue cover from a previous crop provides protection during vulnerable periods before the next crop establishes .
Water Erosion Prediction Project (WEPP)
WEPP simulates the physical processes that cause water erosion, including:
- Weather processes - Daily climate data including rainfall, temperature, solar radiation, and wind information
- Hydrologic processes - Infiltration, runoff, soil evaporation, plant transpiration
- Plant growth and residue processes - Biomass production, canopy cover, residue decomposition
- Soil processes - Changes in soil properties due to tillage, freezing/thawing
- Erosion processes - Soil detachment, transport, and deposition
For each runoff event, WEPP calculates where soil detachment occurs on the landscape, where deposition occurs, how much sediment leaves the field, and the particle size distribution of eroded soil (D. Flanagan and Nearing 1995) ]. The model can simulate many of the physical processes important in soil erosion, including infiltration, runoff, raindrop and flow detachment, sediment transport, deposition, plant growth, and residue decomposition, making it much more comprehensive than previous empirical tools (D. C. Flanagan et al. 2001).

Inherent Environmental Factors
Weather conditions are beyond a farmer’s control. Rainfall amount and intensity significantly impact erosion potential, with more intense storms generally causing more soil movement (Laflen et al. 1991). Temperature patterns affect plant growth rates and soil freezing/thawing cycles that can increase erodibility. Solar radiation influences evapotranspiration rates and plant development, which in turn affect soil moisture and protection.
Many soil properties change only slowly over time. Soil texture (the proportion of sand, silt, and clay) affects how quickly water infiltrates and how easily particles detach. While farmers can gradually build organic matter content over years or decades, the underlying soil texture remains relatively fixed. Similarly, the natural drainage class and parent material of the soil create baseline conditions that management practices must work within.
Topography represents another set of largely fixed conditions. Steeper slopes increase runoff velocity and erosion potential, while longer slopes allow runoff to accumulate and potentially cause more damage downslope. The shape of the slope—whether concave, convex, or uniform—affects where erosion and deposition are most likely to occur. While some topographic factors can be modified through major earthworks, most farmers must develop management strategies that accommodate their existing landscape.
Management Factors
Land managers do have some control over erosion rates. Crop selection determines the timing and amount of protective cover throughout the year, with some crops providing better soil protection than others. For example, winter wheat offers fall and spring cover during otherwise vulnerable periods, while corn might leave soil exposed during critical early-season rainfall periods.
Tillage practices have can noticeable impacts on erosion and, subsequently, water quality (Hansen, Gupta, and Moncrief 2000) . Conventional tillage with multiple passes disrupts soil structure, incorporates protective residue, and creates finely pulverized soil that easily detaches and moves with water. Reduced tillage or no-till approaches maintain more surface protection and soil structure, significantly reducing erosion potential in many environments.
Residue management decisions determine how much protective material remains on the soil surface between crops. Practices like baling straw or removing corn stover for feed or bedding reduce soil protection, while leaving all residue in place maximizes cover. The height of cutting at harvest affects how much standing stubble remains, which influences both water and wind erosion.
Conservation practices promoted by NRCS offer proven solutions for reducing erosion on vulnerable landscapes. Contour farming, strip cropping, terraces, and grassed waterways can dramatically reduce water movement and soil loss. Cover crops provide additional living protection during otherwise fallow periods, particularly during spring and fall transition seasons. Buffer strips and filter areas can capture sediment before it leaves the field.
Wind Erosion Prediction System (WEPS)
WEPS simulates the physical processes that lead to wind erosion, including:
- Weather processes - Wind speed, precipitation, temperature
- Soil processes - Surface conditions like crusting, roughness, and aggregation
- Plant growth and residue processes - Biomass production, residue decomposition
- Management impacts - Tillage effects on soil properties and residue
- Erosion processes - Saltation (bouncing particles), creep (rolling particles), and suspension (airborne particles)
WEPS is unique as a wind erosion model because it determines the “surface state” on a daily and sub-daily basis with respect to the surface’s susceptibility to wind erosion (Wagner, 2013). WEPS tracks three distinct modes of soil movement during wind erosion events. Creep involves larger soil particles (0.84-2.0 mm diameter) that are too heavy to be lifted but roll along the surface when pushed by wind or impacted by other particles. Saltation occurs with mid-sized particles (0.10-0.84 mm diameter) that bounce across the surface in a skipping motion, often dislodging other particles upon impact. Suspension involves smaller particles (<0.10 mm diameter) that can be carried long distances in the air, including PM10 particles that contribute to air quality and visability concerns. By modeling these different transport mechanisms, WEPS can predict not only total soil loss but also the potential for off-site impacts from dust transport.
Inherent Environmental Factors
Wind speed and direction are the primary drivers of erosion potential. Higher wind speeds provide more energy for particle detachment and transport, while predominant wind directions affect which fields and portions of fields are most vulnerable. Regional precipitation patterns affect soil moisture levels, which can significantly increase the wind speed needed to initiate erosion. Temperature regimes influence plant growth rates and soil freezing/thawing cycles that affect erodibility throughout the year.
As with water erosion, inherent soil properties strongly influence wind erosion susceptibility (Kohake, Hagen, and Skidmore 2010). Soil texture is particularly important and largely fixed for a given field. Sandy soils generally have higher erosion potential than clay-rich soils because sand particles are less cohesive and more easily detached by wind forces. The native aggregate stability of a soil determines how readily it can form erosion-resistant clumps, a characteristic tied to clay content and mineralogy that changes only slowly over time through management.
The landscape and field setting represent additional fixed conditions. Regional topography affects wind patterns across the landscape, with some locations naturally experiencing higher wind exposure than others. Distance from natural windbreaks such as forests or bluffs creates baseline wind exposure conditions. Field size and orientation to prevailing winds determine the “fetch” or distance wind can travel across a field, with longer fetches allowing wind to build up more energy.
Management Factors
Farmers can control many factors that determine wind erosion vulnerability. Surface roughness, created through specific tillage operations like strip tillage or ridging, can reduce wind speed at the soil surface. Various implements create different roughness patterns, with some providing better wind protection than others. The timing of these operations relative to typically windy seasons is equally important in determining their protective value.
Residue management decisions significantly impact wind erosion protection. Standing stubble provides effective protection by reducing wind velocity at the soil surface. The height and density of this stubble, determined by crop type and harvest methods, directly correlate with its protective capacity. Flat residue cover also shields soil particles from wind forces. Management decisions about whether to harvest, graze, or retain crop residues have immediate consequences for wind erosion vulnerability.
Wind barriers provide another management option for reducing erosion. Planting shelterbelts, windbreaks, and tree lines can significantly reduce wind velocity across protected fields. Their orientation relative to prevailing winds and spacing along field boundaries determine their effectiveness. Even temporary barriers such as snow fences or tall annual crops in strategic strip arrangements can provide meaningful protection during vulnerable periods.
Crop selection and rotation decisions affect when and how fields are protected from wind. Growing crops create canopy cover that protects the soil while their root systems help maintain soil structure. Winter crops and cover crops can provide protection during typically windy fall and spring seasons when fields might otherwise be bare. Diverse rotations that maintain some living cover throughout the year generally reduce the total duration of high-vulnerability periods.
Model Inputs
The Fieldprint Calculator connects via API to servers that run the WEPP and WEPS models. Understanding these data requirements helps users appreciate what information influences the model results and how their input choices affect erosion estimates.
User-derived inputs
| Input Category | Specific Inputs | Description |
|---|---|---|
| Field Location | Latitude and longitude | Precise coordinates identifying the field location |
| Field Characteristics | Length | Slope length dimension in meters |
| Width | Slope width dimension in meters | |
| Slope steepness | Percent slope or grade of the field | |
| Slope type | Characterization of slope (e.g., “Uniform”) | |
| Aspect | Field orientation in degrees relative to north | |
| Soil Information | Soil identifier | Reference to specific soil data from SSURGO soil databases for texture, organic matter, erodibility factors |
| Management Rotation | Rotation name or custom rotation | Identifier for the specific rotation or supplying a custom rotation |
| Duration | Length of rotation in years | |
| Management events | Sequence of field operations with dates | |
| Operation Details | Operation date | Specific date each operation occurs |
| Operation type | Type of field operation (tillage, planting, harvest, etc.) | |
| Implement used | Specific implement (e.g., “Chisel, twisted shovel”) | |
| Operation parameters | Equipment-specific settings and effects | |
| Crop Information | Crop type | Specific crop being grown |
| Yield | Target or actual yield with units (e.g., 200 bu/ac) |
Field location coordinates allow the system to identify the appropriate climate and soil data for the simulation. Field characteristics define the physical setting that determines how water flows across the landscape and how wind interacts with the field surface.
Management rotation information forms the core of user inputs, as these management decisions strongly influence erosion risk. The Fieldprint Calculator captures detailed information about each operation performed, including the specific implements used, their timing, and their effects on soil and residue. Crop information, including expected yields, helps the models accurately simulate plant growth and residue production that protect soil from erosion.
Background Databases
The Fieldprint Calculator connects to several sophisticated databases to supplement user inputs with detailed environmental information. These background data sources provide scientific information needed for comprehensive erosion modeling without requiring users to gather these complex datasets themselves.
The table below outlines the key background databases and the information they provide:
| Database | Information Provided | How It’s Used in the Models |
|---|---|---|
| USDA SSURGO | Soil texture | Determines infiltration, runoff, and erodibility |
| Organic matter content | Affects soil structure and water-holding capacity | |
| Inherent erodibility factors | Baseline susceptibility to erosion | |
| Soil depth and layering | Influences water movement through soil profile | |
| Soil chemical properties | Affects plant growth and soil stability | |
| PRISM Climate Data | Precipitation patterns | Drives water erosion processes |
| Temperature regimes | Influences plant growth and soil conditions | |
| Wind characteristics | Determines wind erosion potential | |
| Historic weather variability | Creates realistic climate scenarios | |
| CLIGEN Weather Generator | Daily precipitation | Used to model rainfall events |
| Temperature values | Affects plant growth and soil processes | |
| Solar radiation | Drives evapotranspiration and plant development | |
| WINDGEN Database | Wind speed distributions | Models frequency and intensity of wind events |
| Wind direction | Determines directional effects on field | |
| Wind patterns | Estimates seasonal wind erosion risk | |
| Management Templates | Regional cropping systems | Pre-configured scenarios based on common practices |
| Custom cropping systems | User-provided management system | |
| Typical management sequences | Simplifies input for standard practices | |
| Operation parameters | Technical details for common field operations |
The USDA SSURGO database provides comprehensive soil property data for the specified location, enabling the models to simulate how different soils respond to rainfall, runoff, and wind forces. Climate data from PRISM supplies historical climate information for the field location, including the precipitation, temperature, and wind patterns that drive erosion processes.
Weather generators like CLIGEN and WINDGEN use statistical approaches to create realistic daily weather sequences based on historical patterns. These generated weather sequences maintain the statistical characteristics of the local climate while providing the day-to-day variability needed for continuous simulation modeling. Management templates with pre-configured scenarios based on common practices in different regions make it easier for users to select appropriate management systems.
How Inputs Affect Erosion Estimates
The combination of user inputs and background data creates a comprehensive picture of field conditions and processes that determine erosion risk. Management factors that users control have a profound effect on erosion estimates generated by the models. For example:
Crop selection influences the timing and extent of soil cover throughout the year, with some crops providing better protection than others during vulnerable periods. The intensity and timing of tillage operations affect soil structure, residue cover, and surface roughness—all critical factors in both water and wind erosion processes.
Rotation diversity impacts soil health and ensures more consistent ground cover throughout the year, generally reducing erosion potential compared to monoculture systems. Conservation practices such as cover crops, no-till farming, contour farming, and windbreaks can dramatically reduce erosion potential when properly implemented. The models can quantify these benefits, helping users understand the erosion reduction value of different conservation approaches for their specific field conditions.
This data-driven approach allows the Fieldprint Calculator to provide customized erosion estimates that reflect both the inherent characteristics of the field environment and the effects of specific management practices.
Model Outputs
The key output in the Fieldprint Calculator results is:
- Total soil loss (tons/acre/year) - Sum of wind and water erosion estimates
The results page also provides a breakdown of erosion by source, distinguishing between water and wind erosion contributions. This information helps users understand which type of erosion presents the greater challenge for their specific field and can guide appropriate conservation strategies.
Understanding the Context
When interpreting erosion results, context is essential for meaningful assessment. Natural soil formation rates provide an important reference point, as most agricultural soils form at rates of only 0.1 to 0.5 tons per acre per year, which is substantially slower than typical erosion rates on cultivated land. The NRCS-established soil loss tolerance values (T-values) typically range from 1 to 5 tons per acre per year, depending on soil depth and properties. These values represent a compromise between ideal conservation goals and practical agricultural reality.
It’s important to view the model results from a long-term perspective, as they estimate average annual erosion over time rather than predicting exact soil loss for any specific year. Actual erosion in a given year may be higher or lower depending on weather patterns, but the long-term average provides a reliable indicator of sustainability. Management changes that reduce this average erosion rate will contribute to long-term soil conservation and productivity.
Connections to Other Metrics
The soil erosion models integrate with other sustainability metrics in the Fieldprint Calculator, creating a comprehensive picture of environmental performance. The models provide Soil Conditioning Index (SCI) values that feed into the Soil Carbon metric, helping to estimate the trajectory of soil organic matter based on management practices. Looking to the future of the Fieldprint Calculator, the ongoing integration of the SWAT+ model in the Calculator may help estimate potential sediment and nutrient losses to waterways, a key component of agricultural water quality impacts.
The models also track the energy requirements for field operations, which contribute to the Energy Use and Greenhouse Gas Emissions metrics. This integration across metrics ensures consistent analysis and highlights the interconnected nature of agricultural sustainability factors. A management change that reduces erosion often provides co-benefits for multiple sustainability indicators.
Practical Applications
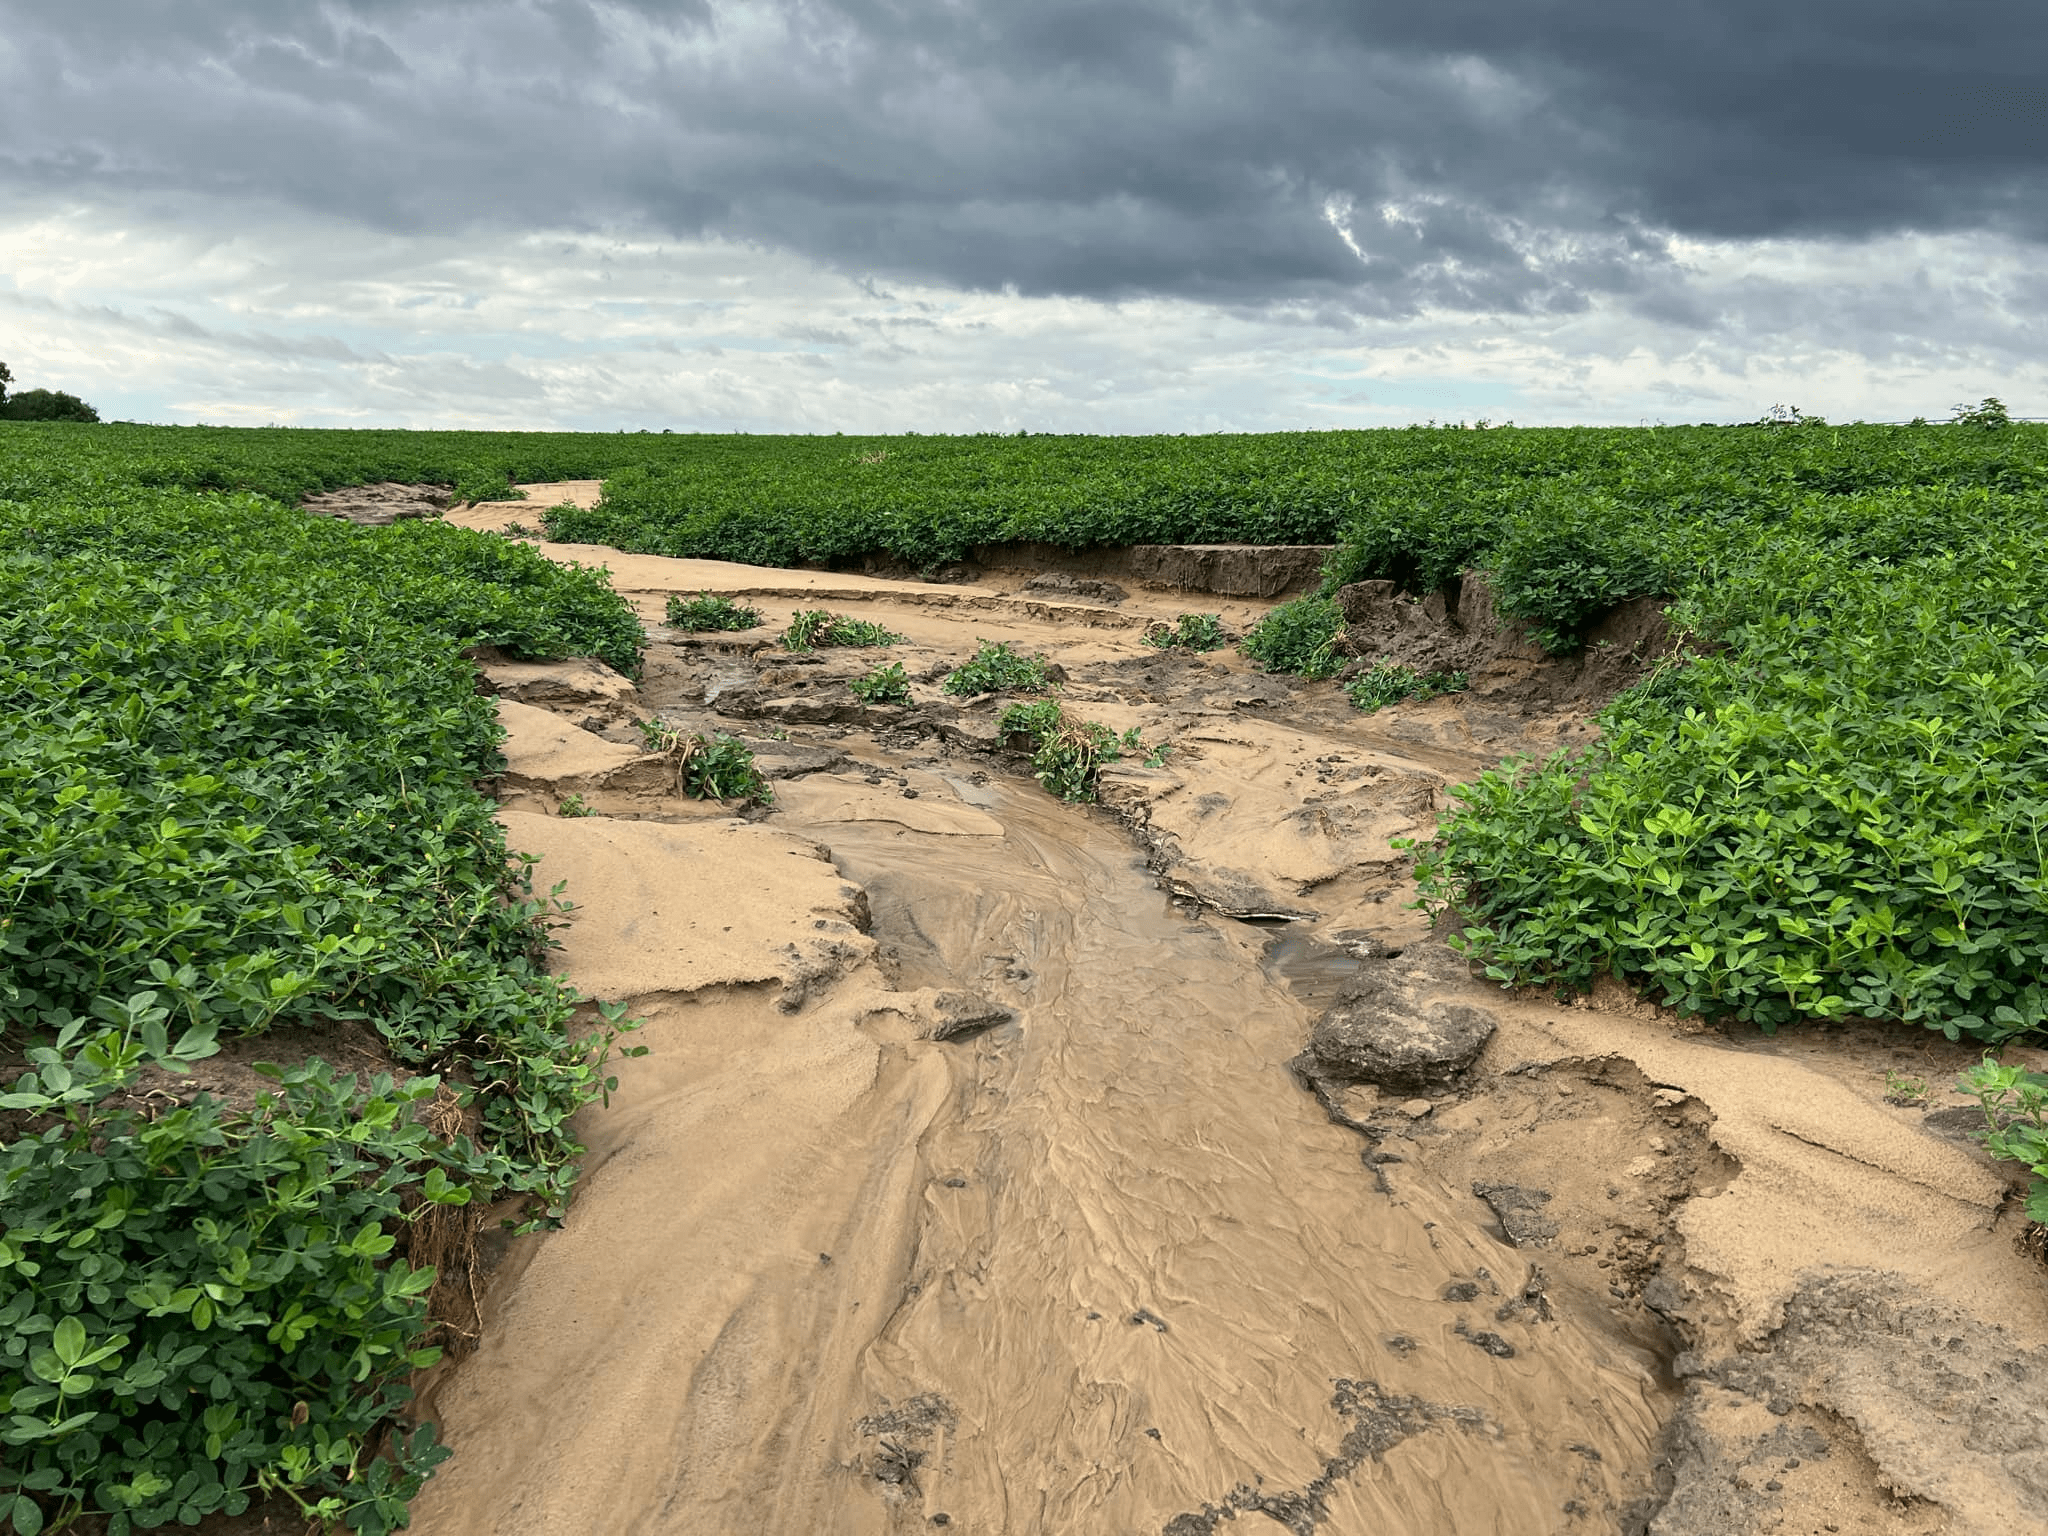
Understanding how WEPP and WEPS work can help you interpret your Soil Conservation metric results and make informed decisions. The models allow you to identify critical periods when your field is most vulnerable to erosion, which can inform timing of cover crops or residue management. You can target conservation efforts to specific areas where erosion control will be most effective, potentially saving both time and resources. These models also enable you to evaluate management changes by simulating how different practices affect erosion risk before implementing them in the field (Figure 1). Additionally, they provide a quantitative way to document improvements in soil conservation over time, which may be valuable for conservation programs or sustainability initiatives.

Model Limitations
Overview
While WEPP and WEPS represent the state-of-the-art in erosion prediction, users should be aware of some limitations. Model results are estimates based on available data and should be interpreted accordingly. Local variations in soil, climate, or management may not be fully captured in the background databases (Hagen 2004). Some conservation practices may have effects beyond what the models can predict, particularly newer or innovative approaches that have limited research data. It’s worth noting that these models are regularly updated as new research becomes available, continuously improving their predictive capabilities.
Delving into the Model Limitations
While WEPP and WEPS represent the state-of-the-art in erosion prediction, they have certain limitations and considerations users should be aware of when interpreting results and making management decisions.
Scale Considerations
The models are designed primarily for field-scale analysis, typically most accurate for areas less than 260 hectares (approximately 640 acres). This scale limitation means they work well for individual fields or small watersheds but are not designed for large-scale regional assessments. One important limitation is that these models do not account for gully erosion or stream bank erosion, which can be significant sources of soil loss in some landscapes. Users should recognize that severely eroded areas with concentrated flow paths may experience more severe erosion than the models predict.
Another scale consideration is that results represent the average for the entire field, while actual erosion may vary significantly within the field. Areas with steeper slopes, different soil types, or reduced cover may experience much higher erosion rates than the field average suggests. This spatial variability means that even fields with acceptable average erosion rates may have problematic areas that require targeted conservation practices.
Data Quality Considerations
The accuracy of predictions depends heavily on the quality of input data provided. Detailed, accurate information about management practices, soil properties, and field characteristics leads to more reliable results. When users provide incomplete or generalized information, the models must rely on default values or assumptions that may not accurately represent field conditions.
Simplified management information, as is sometimes entered into the Fieldprint Calculator, may not capture all field operations or their precise timing and implementation. For example, the actual depth of tillage or the exact amount of residue remaining after harvest may differ from standard assumptions. Similarly, local weather patterns at a specific field may differ from the climate station data used in the models, particularly in regions with significant microclimate variations due to topography.
Process Limitations
The models incorporate certain assumptions about physical processes that may not apply in all situations. For example, WEPP assumes Hortonian overland flow, where rainfall intensity exceeds infiltration capacity. This assumption works well for most agricultural soils but may not accurately represent areas dominated by subsurface flow or where percolation through macropores (earthworm channels, root channels, cracks) is significant.
WEPS uses a somewhat simplified representation of wind patterns and may not capture all local wind effects created by topography or adjacent landscape features. Local wind eddies, channeling effects, or turbulence patterns may create erosion hotspots not fully represented in the model.
Neither model fully accounts for extreme weather events like severe floods or major dust storms, which can cause catastrophic erosion in a single event. The models are designed to predict typical conditions over multiple years rather than worst-case scenarios. Users should understand that actual erosion can exceed model predictions during extreme events, emphasizing the importance of maintaining adequate conservation measures.
Recent Improvements
In recent years, several enhancements have been made to improve these models. As of 2021, WEPS now runs in calibration mode in the Fieldprint Calculator, using grower-provided crop yield to ensure the crop growth simulation is accurate, which produces more reliable erosion estimates.
Conclusion
The WEPP and WEPS models represent decades of scientific research and development by USDA ARS and NRCS. The Soil Conservation metric in the Fieldprint Calculator leverages advanced, process-based erosion models to provide users with science-based estimates of soil loss from both water and wind erosion. These estimates help farmers and supply chain companies identify fields at high risk of erosion and evaluate the potential benefits of conservation practices.
By understanding how these models work and what factors influence their results, users can make more informed decisions about sustainable land management practices that protect soil for future generations while maintaining productive and profitable operations today.