Wildlife and Landscape Diversity Index v1.0
Public Comment Package from Field to Market
Released for public comment on Nov 29, 2023
Introduction
Field to Market’s Metrics Committee proposes replacing the current Habitat Potential Index (HPI) in the Fieldprint Platform® with a new biodiversity metric called the Wildlife and Landscape Diversity (WILD) Index. The WILD Index seeks to approximate the abundance and richness of terrestrial species at the field level by accounting for the conservation management of both the crop field and adjacent semi-natural land cover. The WILD Index does so in a broader landscape context.
This proposed new metric will be a better proxy for biodiversity potential than the currently used HPI. Although the HPI was an innovative and easy-to-use metric, members have expressed the need for the collection of more information for Integrated Pest Management (IPM) practices, more explicit support for edge-of-field practices, and the ability to account for the broader landscape context in which cropland exists. The WILD Index addresses the HPI’s shortcomings in an efficient manner without overburdening growers with data inputs.
The WILD Index is focused exclusively on aboveground, terrestrial biodiversity and does not consider biodiversity in aquatic ecosystems or belowground. Aquatic ecosystem health is partially addressed in our Water Quality and Soil Conservation metrics. Questions about aquatic habitat management would only be relevant to a subset of Fieldprint Platform users with operational control over water resources or riparian areas. Similarly, the Soil Carbon and Soil Conservation metrics may be correlated with belowground soil biodiversity.
Data inputs for the WILD Index are based on user responses to questions about the management of crop fields and adjacent non-crop, semi-natural cover, and remotely sensed information about landscape complexity and land use conversion. The WILD Index metric, as proposed, does not rely upon in situ surveys (transects, point counts, pan traps, acoustic wildlife monitoring, etc.); however, we welcome future efforts and collaborations among Field to Market members to potentially complement and enhance the metric with on-farm visits.
In the proposed metric context, we use the term wildlife to encompass non-domesticated species of plants and animals. Some scientific literature and colloquial language use wildlife to refer to mammals and birds; however, the proposed metric leans on the broader definition of the term (Usher, 1986) .
Emphasizing Semi-natural Cover Over “Habitat”
The WILD Index is designed to be universally applicable across the contiguous United States. It does not measure the quality or quantity of a species-specific habitat type (e.g., bobwhite quail or monarch butterfly habitat). The previous metric label of “Habitat Potential Index” could have confused users because habitat is species-specific. Because species have different habitat requirements, the WILD Index will instead be driven by the non-crop, semi-natural cover on a farm (e.g., hedgerows, grassed waterways, natural and artificial wetlands, riparian forest buffers, etc.). The scientific literature supports the concept that the amount of non-crop vegetation drives biodiversity in agricultural landscapes, and this point will be made throughout the proposed metric documentation.
The WILD Index prioritizes general principles of ecosystem management such as the establishment, conservation, and management of semi-natural cover within agricultural landscapes; the use of diverse, native plant materials where possible; the maintenance of living roots and cover within crop fields; diversified crop rotations; and integrated approaches to pest management in row crop agriculture.
Placing the Field in its Landscape Context
While the focus of the WILD Index is local to field- or farm-level management, it is essential to consider the broader landscape context. Landscape complexity moderates the effectiveness of local management practices. Landscape complexity includes several elements:
Heterogeneity - crop and vegetative diversity
Configuration - the spatial arrangement of landscape elements
Composition - land use types and their relative abundance
A global meta-analysis finds that each of these three dimensions “positively and significantly affects biodiversity,” increasing species richness, abundance, and evenness for vertebrates, invertebrates, and plants (Estrada-Carmona et al., 2022). Patches of semi-natural cover serve as pools for biodiversity, while edge features facilitate movement throughout the landscape and provide structural diversity.
The WILD Index accounts for landscape complexity through the following ways:
Collect info on Vegetation Diversity and Crop Rotation diversity
Configuration calculation
Landscape Diversity calculation using the Shannon Diversity Index
To the point of landscape diversity, we considered the intermediate landscape complexity hypothesis. This hypothesis suggests that in cleared or extremely simple landscapes, the marginal benefit of additional conservation practices is low since there are not existing source population pools in the landscape that may use and benefit from the practice. In moderately complex landscapes, the marginal benefit is greatest (Figure 1). In complex landscapes with high portions of non-crop cover, wildlife populations are robust and have sufficient resources, so additional local conservation management practices may not have a measurable positive impact on biodiversity (Tscharntke et al., 2012) , although other environmental outcomes may still improve (e.g., water quality).

Studies have both supported (Concepción et al., 2012; Grab et al., 2018) and refuted (Batáry et al., 2011; Landis, 2017) this hypothesis. Given the inconclusive evidence, especially in intensive row crop contexts in the United States, the Shannon Diversity Index will be applied as a linear function (see Calculation Example of Shannon Diversity Index).
Overview of the WILD Index Calculation
The proposed metric would be calculated as
\[ WILD\ index = LD(SNC + CC + Tillage) + PM + Rotation - Conversion \]
where
\(LD\) = Landscape Diversity
\(SNC\) = Semi-natural cover score
\(CC\) = Cover Crop score
\(PM\) = Pest Management score
The maximum possible total score is 50 points, of which half can come from the semi-natural cover composite score (see Semi-natural Cover Score Components). Once the revised metric is implemented into the Fieldprint Platform, we plan to conduct a sensitivity analysis to inform users about the weight of the various inputs. The sensitivity analysis will also assist in creating educational materials and providing guidance about what represents low, medium, and high performance to help users and stakeholders communicate about the metric score.
The conceptual diagram of the proposed metric (Figure 2) helps to visualize the nesting of the various components and how they interact with each other, particularly with the moderating factors of size ratio and the landscape diversity, which we explain in detail later in this document.

We provide an example to explore the scoring system and the calculations under a farming scenario in Arkansas in the Excel document titled Supplementary Material B - Farming Scenario.
Semi-natural Cover Score Components
The Semi-natural Cover score will represent up to half of the total available points of the WILD Index (25 points out of 50 points). The Semi-natural Cover score is a composite score that measures the quality and quantity of vegetation land cover “with most of (their) processes and biodiversity intact, though altered by human activity in strength or abundance relative to the natural state,” as defined by the glossary in the Intergovernmental Science-Policy Platform on Biodiversity and Ecosystem Services. According to García-Feced et al. (2015), semi-natural vegetation includes “extensively managed grasslands, agroforestry areas, and all vegetated features that are not used for crop production, such as hedgerows, buffer strips, field margins, and woodlots.” The score considers semi-natural covers that are within or directly adjacent to the Fieldprinted crop field and which may be under the operational control of the grower managing the crop field. These cover types could include field borders, hedgerows, grassed waterways, natural and artificial wetlands, riparian forest buffers, windbreaks, and food plots, among others.
The Semi-natural Cover score comprises five components described in the following sections:
Conservation practice
Vegetative diversity
Size ratio
Configuration
Management
Just as the WILD Index evaluates habitat composition and configuration at the landscape scale, non-crop habitat practices within or directly adjacent to the field are evaluated by patch size (composition) and configuration around and within the field.
The following equation is used to quantify the Semi-natural Cover score:
\[SNC = (CP + V)\times SizeRatio + Configuration + Management\]
where
\(SizeRatio = 1 + \frac{A_{SNC}}{A_{field}}\)
\(CP\) = Conservation practice base score,
\(V\) = Vegetative diversity score
1. Conservation Practices
The WILD Index shares several conservation practice inputs with Field to Market’s Water Quality Metric, the USDA Stewardship Tool for Environmental Performance (STEP), and it incorporates additional conservation practices that are not part of the Water Quality Metric. The practices are limited to those that create new semi-natural cover (e.g., wetland restoration, tree and shrub establishment, hedgerow planting) rather than those practices focused on managing and enhancing existing cover (e.g., wetland enhancement, forest stand improvement, prescribed fire). The latter group of conservation practices is captured in the Management score component of the Semi-natural Cover score.
Each conservation practice is assigned a base value following the NRCS Conservation Practice Physical Effects (CPPE) matrix, which describes the magnitudes of practice effects on each of NRCS’ resource concerns, assuming the practice is implemented correctly and is fully functional. NRCS provides an overall CPPE value for how well the practices address “Fish and Wildlife – Inadequate Habitat” and component scores for how well the practices address food, cover/shelter, and habitat continuity (space). The Index scales these values, so the base practice is out of 10 points.
It is important to clarify that for the purpose of the WILD Index, growers do not need to demonstrate that the practice is part of a contract with USDA NRCS, but rather, that they implement the practices to the best of their abilities according to USDA NRCS guidance. In addition, to limit the amount of time that users will spend listing their conservation practices, we recommend that a maximum of two conservation practices, if any, that are near or adjacent to the field be entered into the Fieldprint Platform.
| NRCS Conservation Practice Standard | Index Base Score |
|---|---|
| Alley Cropping (311) | 6 |
| Constructed Wetland (656) | 4 |
| Conservation Cover * | 8 |
| Contour Buffer Strips (332) | 4 |
| Field Border (386) | 8 |
| Filter Strip 20 ft (393) | 4 |
| Filter Strip 30 ft (393) | 5 |
| Grassed Waterway (412) | 2 |
| Hedgerow Planting (422) | 8 |
| Riparian Forest Buffer (391) | 10 |
| Riparian Herbaceous Cover (390) | 7 |
| Stripcropping (585) | 3 |
| Vegetative Barrier (601) | 2 |
| Windbreak/Shelterbet Establishment (380) | 6 |
| Shallow Water Development and Management (646) ** | 8 |
| Tree/Shrub Establishment (612) ** | 6 |
| Herbaceous Wind Barrier (603) * | 4 |
| Wetland Creation (658) ** | 8 |
| Wetland Restoration (657) ** | 8 |
| Wildlife Habitat Planting (420) ** | 10 |
| No Practice | 0 |
Regardless of the vegetative diversity, configuration, and management, the conservation practice base scores vary according to the practice’s primary purpose. For instance, grassed waterways are seeded often with cool season exotic grasses at a much higher seeding rate than pollinator plantings because their primary purpose is to control sediment and nutrient losses. In contrast, pollinator plantings are often seeded at lower rate with a greater number of species and managed to provide bare ground for bird brood rearing and insect and bird nesting.
2. Vegetation Diversity
A vegetative diversity score, representing the structural and species diversity of the semi-natural habitat patch, is calculated based on the predominant stand composition. For each cover type, point values (1-5) are assigned to different stand composition descriptions.
Depending on the conservation practices selected (view previous section for more information), the user will receive a follow-up question about the vegetative diversity of the corresponding practice. For example, selecting ‘field border’ may denote an herbaceous practice, and the user must select the option (view the table below) which best characterizes the stand (native grasses and forbs, monotypic natives, etc.). The practices can be characterized as herbaceous, wetland, or forest/shrubland according to the NRCS practice standard documents.
| Cover Class | Cover Composition | Veg. Diversity Score |
|---|---|---|
| Herbaceous | Predominately native grasses and forbs, with floral resources available throughout the growing season | 5 |
| Herbaceous | Predominately native grasses and forbs, with floral resources available for part of the growing season | 4 |
| Herbaceous | Predominately native grasses | 3 |
| Herbaceous | Monotypic native grasses | 2 |
| Herbaceous | Predominately introduced species | 1 |
| Herbaceous | Predominately invasive or noxious species | 0 |
| Wetland | Predominately native hydrophytic vegetation | 5 |
| Wetland | Predominately non-native vegetation | 3 |
| Wetland | Frequently cropped | 2 |
| Wetland | Annually cropped | 1 |
| Forest & Shrubland | Predominately native species with woody and herbaceous (grass and forb) cover present | 5 |
| Forest & Shrubland | Predominately native woody species with minimal herbaceous (grass and forb) cover present | 4 |
| Forest & Shrubland | Predominately introduced species woody and herbaceous (grass and forb) cover present | 2 |
| Forest & Shrubland | Predominately native woody species with minimal herbaceous (grass and forb) cover present | 1 |
| Forest & Shrubland | Predominately invasive or noxious species | 0 |
| None | No Semi-natural Vegetation | 0 |
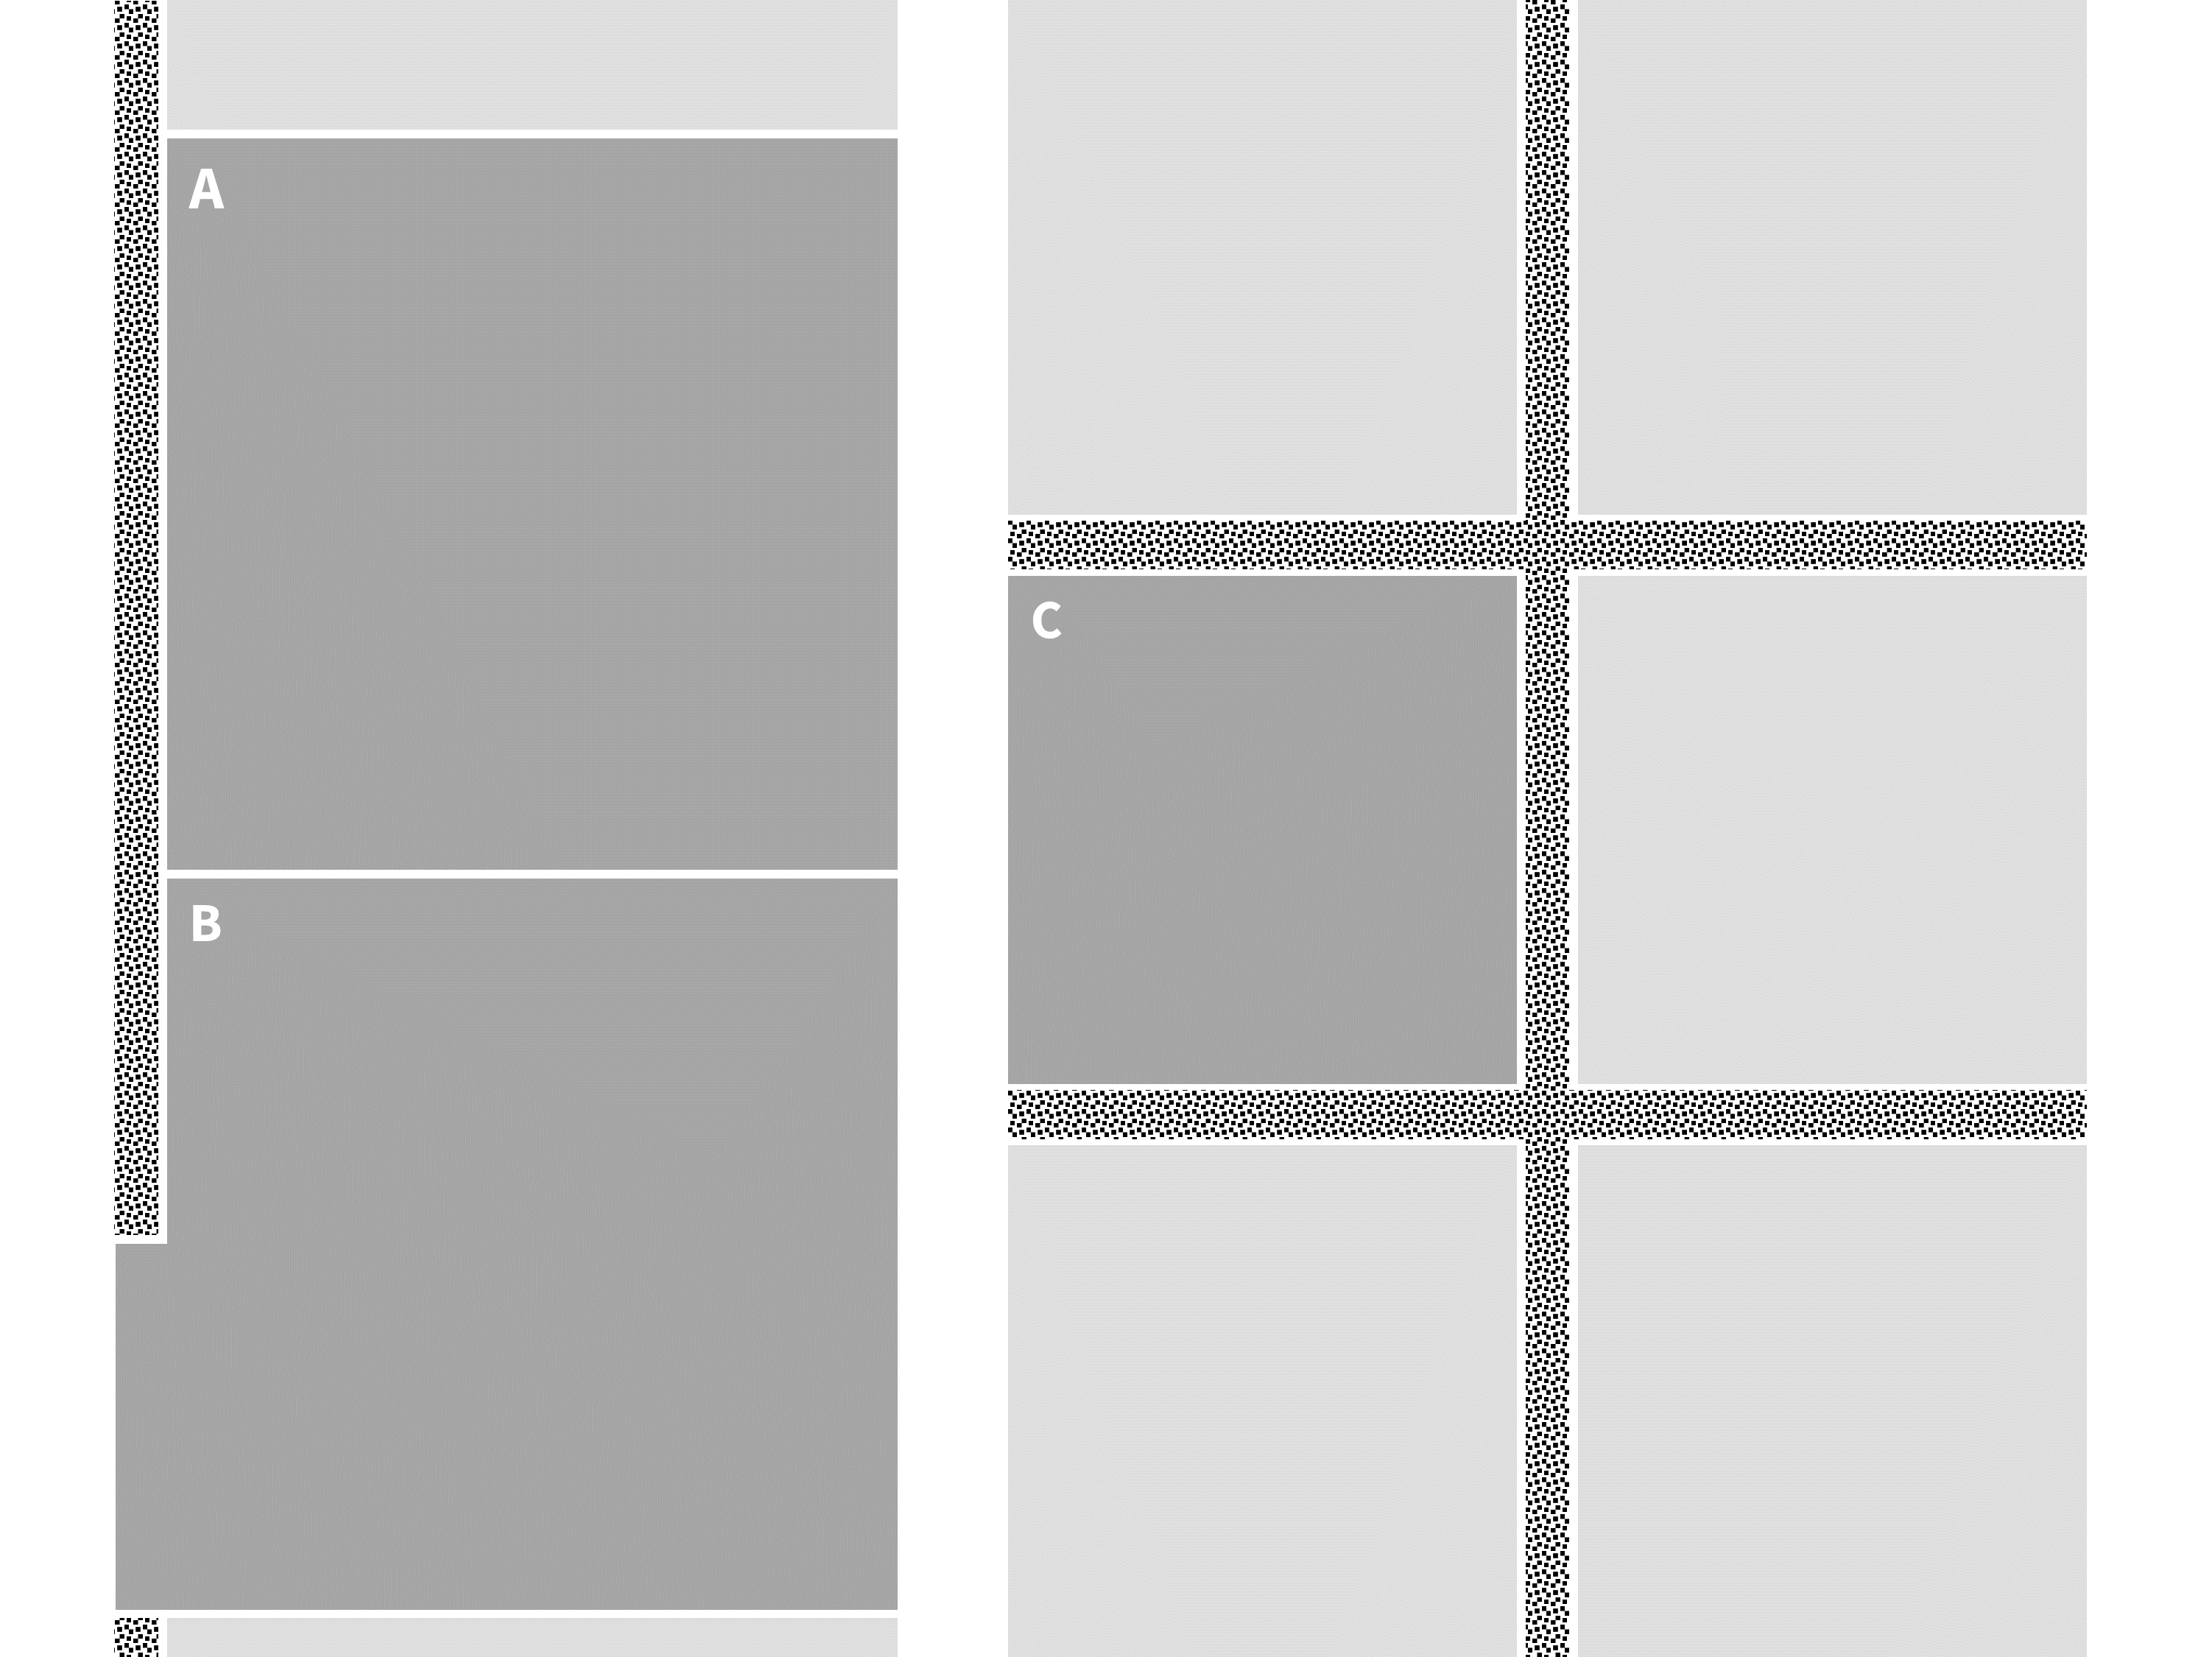
3. Size Ratio
The Size Ratio of the area of semi-natural vegetation cover (\(A_{SNC}\)) to the cropped field area (\(A_{field}\); Figure 3) is important because larger patches of semi-natural cover generally provide more wildlife benefits than smaller patches. Across taxa, field size can have a greater effect on species abundance and diversity than other landscape measures, such as the proportion of cropland in a non-crop habitat or crop diversity (Fahrig et al., 2015; A. E. Martin et al., 2020). At landscape scales, decreasing mean field size can benefit species diversity when controlling for and in the absence of semi-natural vegetation, as smaller fields provide easier access to multiple cover patches, which may provide species with the different resources they need throughout their lifecycles (Redlich et al., 2018; Sirami et al., 2019).
\[ Size\ Ratio\ Multiplier = 1 + \frac{A_{SNC}}{A_{field}} \]
The Size Ratio + 1 is used as a multiplier on the sum of the conservation practice base score and the vegetative diversity score. The maximum Size Ratio is 1 (i.e., the area of semi-natural cover is equal to the field area), so the Size Ratio multiplier is capped at 2. For example, a 50-acre field with 5 acres of riparian forest buffer along one edge has a size ratio multiplier of \(1 + \frac{5}{50} = 1.1\).
A rice field flooded that provides wintering waterfowl habitat (through Conservation Practice Standard 646 Shallow Water Development and Management and/or Conservation Practice Standard 449 Irrigation Water Management) would have a Size Ratio of 1 because all the field acres are in use as semi-natural cover, giving a Size Ratio multiplier of 2 on the points received from the associated conservation practice and vegetative diversity.
The field area in the ratio calculation will simply come from the field area previously saved in the Fieldprint® Calculator. To determine the area of semi-natural cover, users will be prompted to estimate the area, either directly or by length and average width. Rough estimates are acceptable. A measuring tool could be provided; however, we anticipate users may not wish to perform extra data entry steps. The maximum allowed width for edge-of-field cover is 100 m. This distance is based on similar values in NRCS Wildlife Habitat Evaluation Guides which can provide points according to the proximity (~300 feet) of fields to forests or native herbaceous strips.
4. Configuration
There is an interplay between landscape composition and configuration, where landscapes with greater edge density allow for dispersal and spillover from one patch to another. Edge density is the sum of the lengths (m) of all edge segments in the landscape, divided by the total landscape area (m2, Fahrig et al., 2011) . Non-crop field edge density can serve as an effective indicator of species diversity (Ma et al., 2013; Whittaker, 1960) . In a meta-analysis looking at how spatial arrangement of crop fields and natural habitats impact arthropods, researchers found 70% of pollinator and 44% of natural enemy species reached highest abundances and pollination and pest control improved 1.7- and 1.4-fold respectively in landscapes with high edge density (E. A. Martin et al., 2019).
Rather than measuring edge density at the landscape level, the WILD Index will look at the spatial arrangement of the semi-natural cover with respect to the Fieldprinted field. Spillover of biodiversity into the cropped area, and ability to benefit from certain in-field practices is associated with the size of the field and distance to semi-natural habitat (Figure 3). Placing the semi-natural habitat on one or more sides may support in-field biodiversity.
The Configuration points will be awarded programmatically in the Fieldprint Calculator. We propose using the U.S. Geological Survey (USGS) National Land Cover Database (NLCD). First, a 100-m field buffer is created and then divided into 10 equal area sections. Using the corresponding NLCD layer for the crop year, the percentage of non-crop cover in each section will be determined. The sum of sections found to have more than 10 percent cover will be divided by 10 and multiplied by four. If the farmer reported semi-natural cover within the field, an additional point will be awarded. The total points will not exceed four.
5. Management
The purposes of managing semi-natural covers could be multi-faceted: increasing stand diversity and structure (Greenfield et al., 2005); controlling invasive, noxious, or undesirable vegetation (Fuhlendorf et al., 2011); and clearing vegetation or plant debris choking out the understory (Spaeth et al., 2013), among others.
The management component considers activities completed within the last five years. We believe this time window is sufficiently flexible to give credit to growers across wetter or drier areas in the contiguous U.S. in terms of the varying frequency that semi-natural covers need management.
| Management Activity | Management Score |
|---|---|
| Prescribed Fire | 1 |
| Prescribed Grazing | 1 |
| Forest Stand Improvement ** | 1 |
| Structures for Wildlife (649) | 1 |
| Mowing outside Primary Nesting Season | 1 |
| Spot treatment of invasive/noxious species | 1 |
| Light discing * | 1 |
| No management | 0 |
Landscape Diversity
The WILD Index measures landscape diversity using the Shannon Diversity Index, or SHDI (Shannon & Weaver, 1949). Also known as the Shannon-Wiener index or Shannon entropy, the SHDI is a common approach across landscape ecology literature (Egerer et al., 2018; Kordbacheh et al., 2020; Redlich et al., 2018). The SHDI measures the abundance and evenness of land cover categories. Compared to other landscape diversity metrics, such as the Simpson Diversity Index, SHDI is more sensitive to rare land covers (Jost, 2006), making it more appropriate for use in relatively simple, row-crop-dominated landscapes (Nagendra, 2002). It considers the number, or richness, of land covers (m) and their relative abundances (\(P_i\))
\[SHDI = − \sum_{i = 1}^m P_i \times\ \ln(P_i)\]
where \(P_i\) is the proportion of class \(i\), and \(m\) is the number of classes.
As with Configuration, we propose using the USGS National Land Cover Database (NLCD) to calculate the SHDI. The NLCD provides nationwide data on land cover and land cover change at a 30-m resolution with 16 land classes. When considering the impact of landscape dynamics on species’ diversity, most studies define landscape scale according to species’ or taxon’s range, i.e. 3km for native bees (Kordbacheh et al., 2020), <2km for arthropods (Mitchell et al., 2014) , 0.1-5 km for birds (Callaghan et al., 2018; West et al., 2016), among other examples. The WILD Index calculates a whole-area SHDI for the area in a 3-km buffer around the field boundary, including the field.
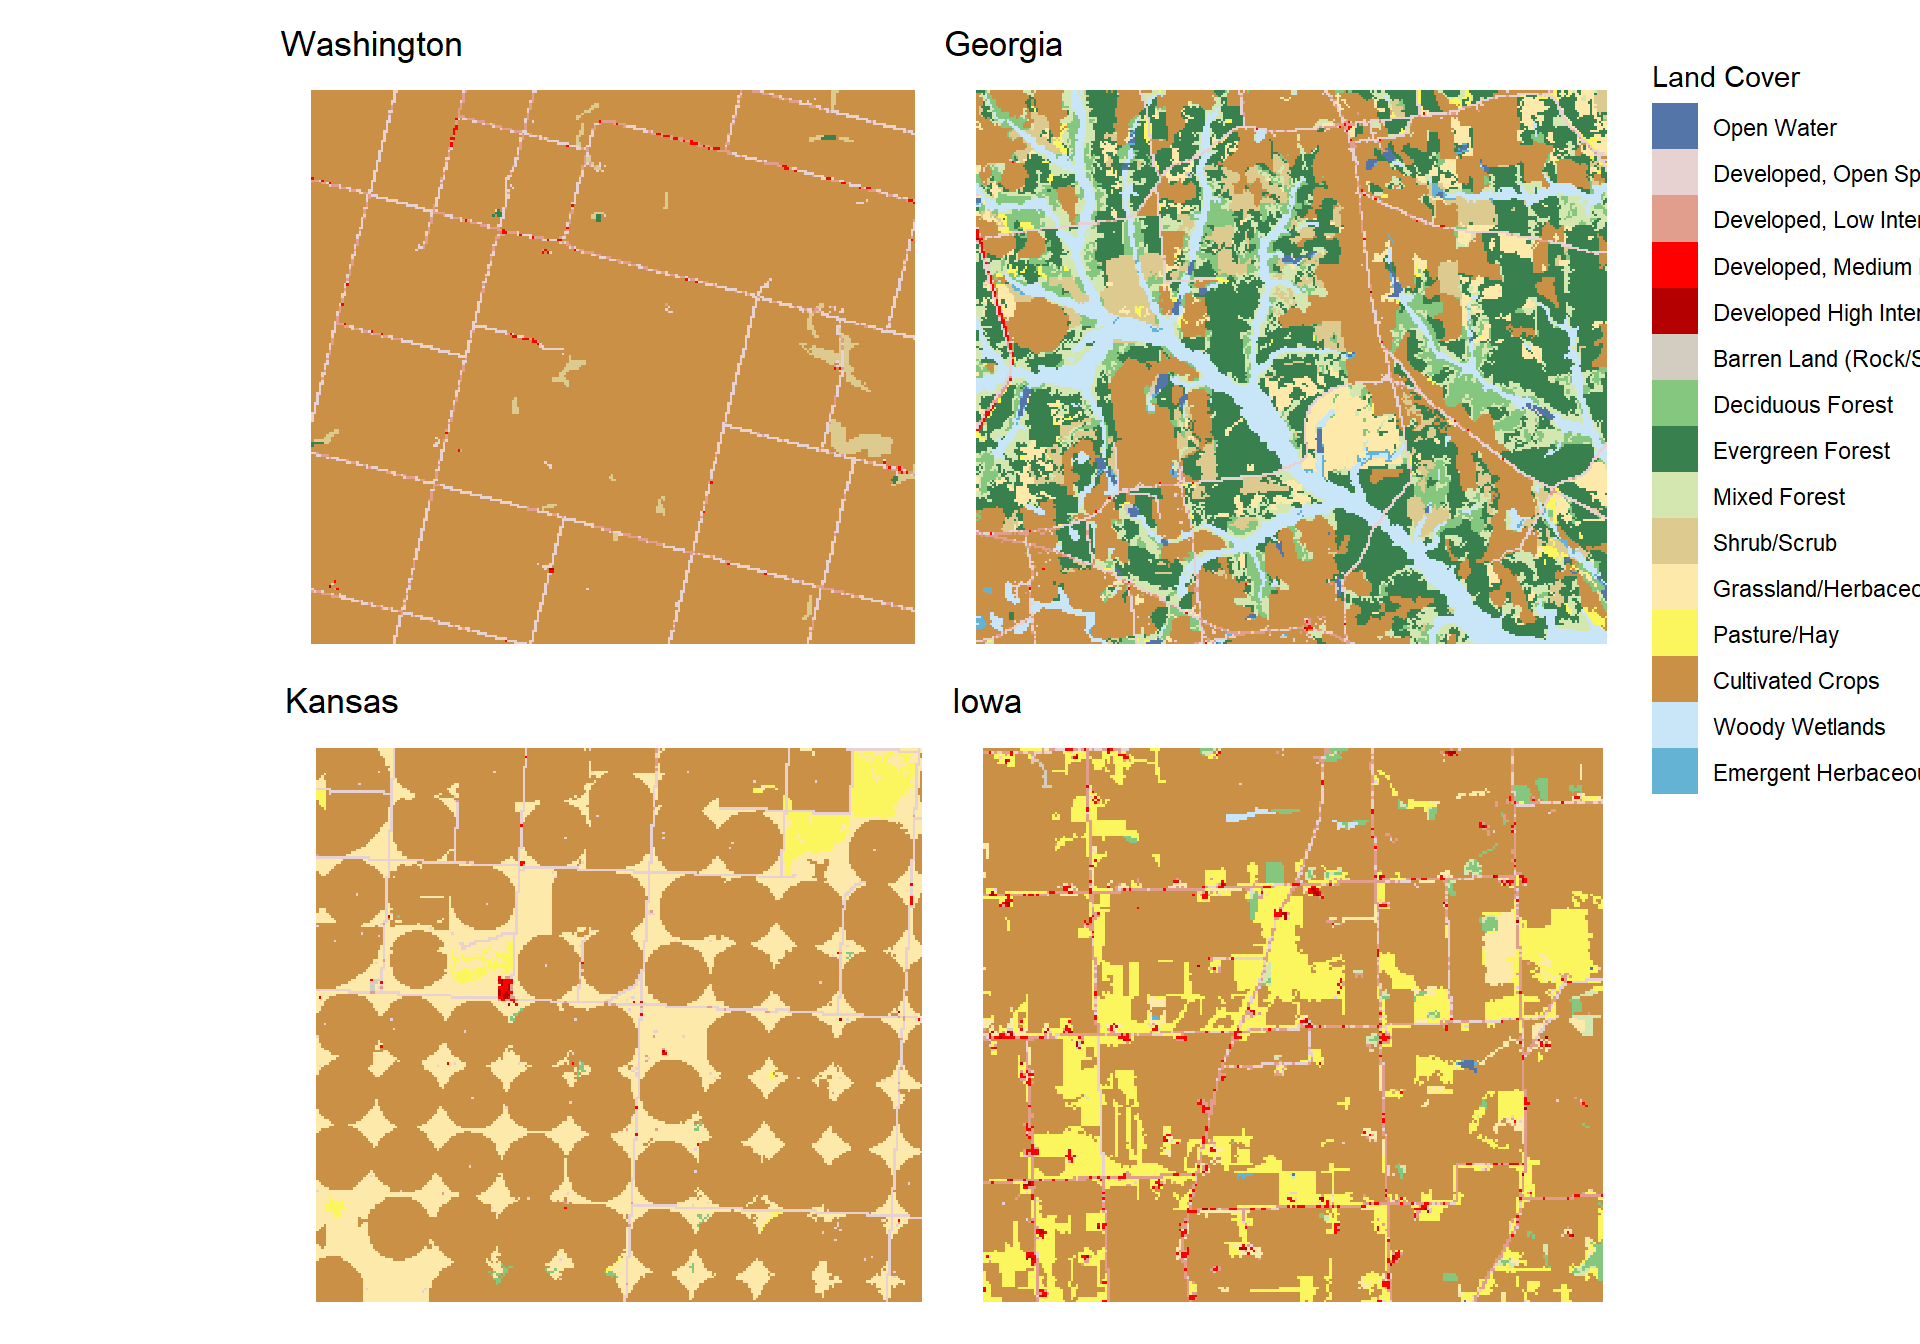
Calculation Example of Shannon Diversity Index
Figure 2 below shows the land cover around fields in four different U.S. states. Whole-area Shannon Index values for the 3 km buffers were calculated using the R package landscapemetrics (Hesselbarth et al., 2019).
The example output of the whole-area SHDI is as follows:
| level | metric | georgia | wash | kansas | iowa |
|---|---|---|---|---|---|
| landscape | shdi | 1.91 | 0.28 | 0.76 | 0.88 |
As landscape complexity moderates the effects of local conservation practices, the SHDI score will serve as a multiplier for field-level habitat provisioning practices, such as non-crop and semi-natural areas. For instance, a 1-acre, non-native buffer practice (30-ft buffer alongside one edge of a square 40-acre field) earning a Semi-Natural Habitat score of 5 would be worth 7.5 points if implemented on a field with a SHDI landscape complexity score of 1.5. Using the multiplier in the manner we are proposing implies a linear relationship: as landscapes become more complex, the benefits of local conservation practices increase as well.
Cropland Management Components
Beyond landscape complexity and semi-natural cover, we account for five other components in the WILD Index described in the next sections:
Pest management
Cropland conversion
Crop rotation
Cover crops
Tillage
1. Pest Management
The proposed revision gives us the opportunity to address Integrated Pest Management (IPM), one aspect of the current metric (HPI) which members have requested to enhance over the years. Field to Market has convened stakeholders to discuss topics related to pest management in several efforts. We hosted a Pest Management Task Force under the Verification (now Standards) Committee from 2018 to 2019 and a Pest Management Subgroup under the Metrics Committee in 2020. Those convenings resulted in a great deal of discovery about what matters to Field to Market members regarding pest management, the state of science, and what practical and useful information growers can share for their pest management practices. Field to Market published a report in 2020, Trends in Pest Management in U.S. Agriculture, to capture some of the most important lessons of those efforts.
One of the outcomes of the 2020 Pest Management Subgroup was the recommendation to improve and expand on the concepts of IPM once the time came to revise the Biodiversity Metric. We believe the Pest Management component of the proposed WILD Index is a significant improvement compared to the previous metric version. It does so by asking essential IPM practice information from growers, which supply chain actors have a great need for, without overburdening growers with data inputs.
The Pest Management component of the WILD Index is focused on the application of best management practices that have been shown to reduce the risk of pesticide loss from leaching, runoff, and drift. We based the IPM questionnaire on the USDA framework of Prevention, Avoidance, Monitoring, and Suppression practices (USDA NRCS, 2019). The pest management score represents 10 points (20%) of the total WILD Index score.
Since pest management practices would typically not vary significantly across fields for a given grower, we propose that the Pest Management questionnaire be asked once a year at the grower level and not for each individual field and crop. A grower would have the chance to review the questionnaire every year to confirm any changes to the IPM practices being applied.
We include the Pest Management questionnaire for review as Supplementary Material A - Pest Management Component Questionnaire.
2. Cropland Conversion
The conversion of natural ecosystems to agricultural use has been recognized as a significant driver of biodiversity loss (Lark et al., 2020; Newbold et al., 2016; Semenchuk et al., 2022).
Field to Market will attempt to automatically detect any land use changes for a given field boundary with one or more publicly available database, such as the USGS Land Change Monitoring, Assessment, and Projection (LCMAP) and the Cropland Data Layers (CDL). We will ask growers to confirm the findings of the land use changes, if any. Points are subtracted from the Index score according to the recency of the conversion.
| Cropland Conversion | Points |
|---|---|
| None or >20 years ago | 0 |
| last 5 years | -4 |
| last 6-10 years | -3 |
| last 11-15 years | -2 |
| last 16-20 years | -1 |
3. Crop Rotation
At a landscape level, increasing crop diversity may benefit biodiversity if many species of organisms require a distinct crop type for feeding, oviposition, and other habitat services. Second, increasing crop diversity may also benefit biodiversity through a landscape-level effect if many species require multiple resources provided by different crop types [i.e., landscape complementation; Sirami et al. (2019)]. Cropland heterogeneity is also discussed in A. E. Martin et al. (2020) and Mineau & McLaughlin (1996). Several researchers have attempted to provide clarity on the connection between diverse crop rotations and biodiversity outcomes (Beillouin et al., 2021; Bezdicek & Granatstein, 1989; Bowles et al., 2020; Tamburini et al., 2020).
The WILD Index prioritizes diverse crop rotations. A user can earn up to 4 points, with the possibility of up to 2 extra points if a small fraction of a crop is deliberately left unharvested to support local wildlife with food and cover during the winter months.
| Crop Rotation | Points |
|---|---|
| 1-2 crops | 0 |
| 3 crops | 2 |
| 4 crops | 3 |
| >4 crops | 4 |
| Leave 0.5-3% of standing crop | +1 extra |
| Leave > 3% of standing crop | +2 extra |
4. Cover Crops
In general, scientific literature indicates that cover crop adoption provides benefits to the ecosystem (Lu et al., 2000; Sharma et al., 2018; Tillman et al., 2012; Wilcoxen et al., 2018). However, localized conditions may require growers to carefully plan for potential trade-offs, such as the need for additional pest management (Bakker et al., 2016; Zagorski & Swihart, 2020), reduced yields (Deines et al., 2023), and limited water resources (Jones et al., 2020; Lewis et al., 2018; Reese et al., 2014).
The WILD Index provides a gradient of points based on the diversity of the cover crop mixture and how long the cover crops developed before termination.
| Cover Crops | Points |
|---|---|
| Winter Hardy, terminated after flowering | 5 |
| Winter Hardy, multi-species | 4 |
| Winter Hardy, single species | 3 |
| Winter Terminal, multi-species | 2 |
| Winter Terminal, single species | 1 |
| No Cover Crop | 0 |
5. Tillage
Conservation tillage reduces soil disturbance and leaves crop residues on the soil surface, which can in turn provide nesting and winter cover to insects and birds (Warburton & Klimstra, 1984). Switching from conventional to no-tillage has been shown to significantly benefit butterfly, spider, and bird richness (A. E. Martin et al., 2020). Researchers in Illinois found that nesting density and nest success was higher in no-till fields than it was in conventionally tilled fields due to the increased opportunity to conceal nests in crop residue (VanBeek et al., 2014). Similarly in North Carolina soybean systems, woodcock densities were at least twice as high in no-till fields planted after corn than in other field treatments due to greater foraging opportunities and thermal protection (Blackman et al., 2012). Whereas complex landscapes support more robust opportunities for biological pest management than simple landscapes, conservation tillage can enhance biological control of pests by predators and parasitoids and partially offset the effects of simplified landscapes at the field level (Tamburini et al., 2016).
The WILD Index will award users points according to the percentage of residue left on the field surface. A user can earn up to 5 points by practicing no-till.
| Tillage and Unharvested Crops | Points |
|---|---|
| <15% residue | 0 |
| 15-30% residue | 3 |
| >30% residue | 5 |
Discussion
With the WILD Index, Field to Market strives to develop a biodiversity metric that serves the entire agricultural value chain, from growers to retailers. We believe that the metric collects essential information that enables growers to engage in the journey of continuous improvement and provides useful insights to value chain actors to report to their stakeholders.
The updated Biodiversity Metric could fulfill several purposes for Fieldprint Platform users. Beyond the final metric score, which is meant to present a general idea of performance, the intermediate data entries for the multiple metric components provide a wealth of information to find areas of improvement and to track progress over time.
Applying practices that benefit biodiversity is an intentional effort that takes time, planning, and careful execution. In general, growers will score high in the metric if they implement several of the following practices or concepts:
Decrease the tillage intensity and/or number of tillage passes.
At least one conservation practice which is managed accordingly (e.g., conservation cover with mowing or spot treatment for invasive species) near the field entered into the Fieldprint Platform.
High adoption of IPM practices, such as making decisions based on scouting activities, good record-keeping, and drift reduction techniques.
Avoid the conversion of natural or semi-natural areas to cropland.
Implement rotations with more than two crops when feasible and/or add cover crops in the off-season when possible.
Manage edge of field where beneficial organisms reside.
The development of the WILD Index follows an extensive literature review. We strived to distill concepts and models in a cohesive manner to present a more holistic view of practices that support terrestrial biodiversity with the hope that environmental outcomes will be realized for the benefit of the agricultural sector.
Appendix 1: Summary of WILD Index Inputs
The table below summarizes the data inputs to calculate the WILD Index. The table informs users about inputs that will be new to the Fieldprint Platform®, inputs that will be calculated via backend algorithms, and current inputs that will be repurposed or revised.
| Component | Subcategory | Input | Notes | New Input |
|---|---|---|---|---|
| Landscape complexity | Shannon Diversity Index | Calculated via backend algorithms | Yes | |
| Semi-natural cover | Conservation practices | Up to two conservation practices per field | Requires user input | No |
| Semi-natural cover: conservation practices | Vegetation diversity | Selection of vegetation properties of the conservation practices | Requires user input | Yes |
| Semi-natural cover: conservation practices | Size ratio | Estimate of conservation practice size (e.g., buffer strip 150-ft long by 30-ft wide) | Requires user input | Yes |
| Semi-natural cover | Configuration | Coverage of edge-of-field semi-natural cover | Calculated via backend algorithms | Yes |
| Semi-natural cover | Management | Selection of management practices (e.g., prescribed fire, mowing, etc.) | Requires user input | Yes |
| Cropland management | Pest management | Selection of pest management practices | Requires user input at the grower level once a year | Yes |
| Cropland management | Cropland conversion | Land use change | Calculated via backend algorithms and confirmed by user input | Yes |
| Cropland management | Crop rotation | Crop rotation sequence | Calculated via backend algorithms | Yes |
| Cropland management | Cover crop | Cover crop implementation and characteristics | Requires user input | No |
| Cropland management | Tillage | Tillage type | Requires user input | No |
Total inputs: 11 with nested questions and/or conditional logic
Requires user input: 8
Uses backend calculation: 3
New inputs: 8 with nested questions and/or conditional logic
Revised inputs: 3
- Conservation practices, tillage, and cover crop
Net new inputs with user requirement: 5 (11 new inputs - 3 revised inputs – 3 backend-calculated inputs)
References
Bakker, M. G., Acharya, J., Moorman, T. B., Robertson, A. E., & Kaspar, T. C. (2016). The potential for cereal rye cover crops to host corn seedling pathogens. Phytopathology®, 106(6), 591–601. https://doi.org/10.1094/PHYTO-09-15-0214-R
Batáry, P., Báldi, A., Kleijn, D., & Tscharntke, T. (2011). Landscape-moderated biodiversity effects of agri-environmental management: A meta-analysis. Proceedings of the Royal Society B: Biological Sciences, 278(1713), 1894–1902. https://doi.org/10.1098/rspb.2010.1923
Beillouin, D., Ben-Ari, T., Malézieux, E., Seufert, V., & Makowski, D. (2021). Positive but variable effects of crop diversification on biodiversity and ecosystem services. Global Change Biology, 27(19), 4697–4710. https://doi.org/10.1111/gcb.15747
Bezdicek, D. F., & Granatstein, D. (1989). Crop rotation efficiencies and biological diversity in farming systems. American Journal of Alternative Agriculture, 4(3-4), 111–119. https://doi.org/10.1017/S0889189300002927
Blackman, E. B., Deperno, C. S., Heiniger, R. W., Krachey, M. J., Moorman, C. E., & Peterson, M. N. (2012). Effects of crop field characteristics on nocturnal winter use by american woodcock. The Journal of Wildlife Management, 76(3), 528–533. https://doi.org/10.1002/jwmg.254
Bowles, T. M., Mooshammer, M., Socolar, Y., Calderón, F., Cavigelli, M. A., Culman, S. W., Deen, W., Drury, C. F., Garcia, A. G. y., Gaudin, A. C. M., Harkcom, W. S., Lehman, R. M., Osborne, S. L., Robertson, G. P., Salerno, J., Schmer, M. R., Strock, J., & Grandy, A. S. (2020). Long-term evidence shows that crop-rotation diversification increases agricultural resilience to adverse growing conditions in north america. One Earth, 2(3), 284–293. https://doi.org/10.1016/j.oneear.2020.02.007
Callaghan, C. T., Major, R. E., Lyons, M. B., Martin, J. M., & Kingsford, R. T. (2018). The effects of local and landscape habitat attributes on bird diversity in urban greenspaces. Ecosphere, 9(7), e02347. https://doi.org/10.1002/ecs2.2347
Concepción, E. D., Díaz, M., Kleijn, D., Báldi, A., Batáry, P., Clough, Y., Gabriel, D., Herzog, F., Holzschuh, A., Knop, E., Marshall, E. J. P., Tscharntke, T., & Verhulst, J. (2012). Interactive effects of landscape context constrain the effectiveness of local agri-environmental management. Journal of Applied Ecology, 49(3), 695–705. https://doi.org/10.1111/j.1365-2664.2012.02131.x
Deines, J. M., Guan, K., Lopez, B., Zhou, Q., White, C. S., Wang, S., & Lobell, D. B. (2023). Recent cover crop adoption is associated with small maize and soybean yield losses in the united states. Global Change Biology, 29(3), 794–807. https://doi.org/10.1111/gcb.16489
Egerer, M., Li, K., & Ong, T. (2018). Context matters: Contrasting ladybird beetle responses to urban environments across two US regions. Sustainability, 10(6), 1829. https://doi.org/10.3390/su10061829
Estrada-Carmona, N., Sánchez, A. C., Remans, R., & Jones, S. K. (2022). Complex agricultural landscapes host more biodiversity than simple ones: A global meta-analysis. Proceedings of the National Academy of Sciences, 119(38), e2203385119. https://doi.org/10.1073/pnas.2203385119
Fahrig, L., Baudry, J., Brotons, L., Burel, F. G., Crist, T. O., Fuller, R. J., Sirami, C., Siriwardena, G. M., & Martin, J.-L. (2011). Functional landscape heterogeneity and animal biodiversity in agricultural landscapes: Heterogeneity and biodiversity. Ecology Letters, 14(2), 101–112. https://doi.org/10.1111/j.1461-0248.2010.01559.x
Fahrig, L., Girard, J., Duro, D., Pasher, J., Smith, A., Javorek, S., King, D., Lindsay, K. F., Mitchell, S., & Tischendorf, L. (2015). Farmlands with smaller crop fields have higher within-field biodiversity. Agriculture, Ecosystems & Environment, 200, 219–234. https://doi.org/10.1016/j.agee.2014.11.018
Fuhlendorf, S. D., Limb, R. F., Engle, D. M., & Miller, R. F. (2011). Assessment of prescribed fire as a conservation practice. Conservation Benefits of Rangeland Practices: Assessment, Recommendations, and Knowledge Gaps. Washington, DC, USA: USDA-NRCS, 75104.
García-Feced, C., Weissteiner, C. J., Baraldi, A., Paracchini, M. L., Maes, J., Zulian, G., Kempen, M., Elbersen, B., & Pérez-Soba, M. (2015). Semi-natural vegetation in agricultural land: European map and links to ecosystem service supply. Agronomy for Sustainable Development, 35(1), 273–283. https://doi.org/10.1007/s13593-014-0238-1
Grab, H., Poveda, K., Danforth, B., & Loeb, G. (2018). Landscape context shifts the balance of costs and benefits from wildflower borders on multiple ecosystem services. Proceedings of the Royal Society B: Biological Sciences, 285(1884), 20181102. https://doi.org/10.1098/rspb.2018.1102
Greenfield, K., Burger Jr, L., Golden, L., & Graham, P. (2005). Light disking to enhance early successional wildlife habitat in grasslands and old fields: Wildlife benefits and erosion potential. USDA natural resources and conservation service. Natural Resource and Conservation Service Technical Note, 19032.
Hesselbarth, M. H. K., Sciaini, M., With, K. A., Wiegand, K., & Nowosad, J. (2019). Landscapemetrics: An open-source r tool to calculate landscape metrics. Ecography, 42(10), 1648–1657. https://doi.org/10.1111/ecog.04617
Jones, C., Olson-Rutz, K., Miller, P., & Zabinski, C. (2020). Cover crop management in semi-arid regions: Effect on soil and cash crop. Crops & Soils, 53(5), 42–51. https://doi.org/10.1002/crso.20065
Jost, L. (2006). Entropy and diversity. Oikos, 113(2), 363–375. https://doi.org/10.1111/j.2006.0030-1299.14714.x
Kordbacheh, F., Liebman, M., & Harris, M. (2020). Strips of prairie vegetation placed within row crops can sustain native bee communities. PLoS ONE, 15(10), e0240354. https://doi.org/10.1371/journal.pone.0240354
Landis, D. A. (2017). Designing agricultural landscapes for biodiversity-based ecosystem services. Basic and Applied Ecology, 18, 1–12. https://doi.org/10.1016/j.baae.2016.07.005
Lark, T. J., Spawn, S. A., Bougie, M., & Gibbs, H. K. (2020). Cropland expansion in the united states produces marginal yields at high costs to wildlife. Nature Communications, 11(1), 4295. https://doi.org/10.1038/s41467-020-18045-z
Lewis, K. L., Burke, J. A., Keeling, W. S., McCallister, D. M., DeLaune, P. B., & Keeling, J. W. (2018). Soil benefits and yield limitations of cover crop use in texas high plains cotton. Agronomy Journal, 110(4), 1616–1623. https://doi.org/10.2134/agronj2018.02.0092
Lu, Y.-C., WATKINS, K. B., TEASDALE, J. R., & ABDUL-BAKI, A. A. (2000). Cover crops in sustainable food production. Food Reviews International, 16(2), 121–157. https://doi.org/10.1081/FRI-100100285
Ma, M., Hietala, R., Kuussaari, M., & Helenius, J. (2013). Impacts of edge density of field patches on plant species richness and community turnover among margin habitats in agricultural landscapes. Ecological Indicators, 31, 25–34. https://doi.org/https://doi.org/10.1016/j.ecolind.2012.07.012
Martin, A. E., Collins, S. J., Crowe, S., Girard, J., Naujokaitis-Lewis, I., Smith, A. C., Lindsay, K., Mitchell, S., & Fahrig, L. (2020). Effects of farmland heterogeneity on biodiversity are similar toor even larger thanthe effects of farming practices. Agriculture, Ecosystems & Environment, 288, 106698. https://doi.org/10.1016/j.agee.2019.106698
Martin, E. A., Dainese, M., Clough, Y., Báldi, A., Bommarco, R., Gagic, V., Garratt, M. P. D., Holzschuh, A., Kleijn, D., Kovács-Hostyánszki, A., Marini, L., Potts, S. G., Smith, H. G., Al Hassan, D., Albrecht, M., Andersson, G. K. S., Asís, J. D., Aviron, S., Balzan, M. V., … Steffan-Dewenter, I. (2019). The interplay of landscape composition and configuration: New pathways to manage functional biodiversity and agroecosystem services across europe. Ecology Letters, 22(7), 1083–1094. https://doi.org/10.1111/ele.13265
Mineau, P., & McLaughlin, A. (1996). Conservation of biodiversity within canadian agricultural landscapes: Integrating habitat for wildlife. Journal of Agricultural and Environmental Ethics, 9(2), 93–113. https://doi.org/10.1007/BF03055296
Mitchell, M. G. E., Bennett, E. M., & Gonzalez, A. (2014). Agricultural landscape structure affects arthropod diversity and arthropod-derived ecosystem services. Agriculture, Ecosystems & Environment, 192, 144–151. https://doi.org/10.1016/j.agee.2014.04.015
Nagendra, H. (2002). Opposite trends in response for the shannon and simpson indices of landscape diversity. Applied Geography, 22(2), 175–186. https://doi.org/10.1016/S0143-6228(02)00002-4
Newbold, T., Hudson, L. N., Arnell, A. P., Contu, S., De Palma, A., Ferrier, S., Hill, S. L. L., Hoskins, A. J., Lysenko, I., Phillips, H. R. P., Burton, V. J., Chng, C. W. T., Emerson, S., Gao, D., Pask-Hale, G., Hutton, J., Jung, M., Sanchez-Ortiz, K., Simmons, B. I., … Purvis, A. (2016). Has land use pushed terrestrial biodiversity beyond the planetary boundary? A global assessment. Science, 353(6296), 288–291. https://doi.org/10.1126/science.aaf2201
Redlich, S., Martin, E. A., & Steffan-Dewenter, I. (2018). Landscape-level crop diversity benefits biological pest control. Journal of Applied Ecology, 55(5), 2419–2428. https://doi.org/10.1111/1365-2664.13126
Reese, C. L., Clay, D. E., Clay, S. A., Bich, A. D., Kennedy, A. C., Hansen, S. A., & Moriles, J. (2014). Winter cover crops impact on corn production in semiarid regions. Agronomy Journal, 106(4), 1479–1488. https://doi.org/10.2134/agronj13.0540
Semenchuk, P., Plutzar, C., Kastner, T., Matej, S., Bidoglio, G., Erb, K.-H., Essl, F., Haberl, H., Wessely, J., Krausmann, F., & Dullinger, S. (2022). Relative effects of land conversion and land-use intensity on terrestrial vertebrate diversity. Nature Communications, 13(1), 615. https://doi.org/10.1038/s41467-022-28245-4
Shannon, C., & Weaver, W. (1949). The mathematical theory of environments. The Mathematical Theory of Communication, 1–93.
Sharma, P., Singh, A., Kahlon, C. S., Brar, A. S., Grover, K. K., Dia, M., & Steiner, R. L. (2018). The role of cover crops towards sustainable soil health and agriculturea review paper. American Journal of Plant Sciences, 9(9), 1935–1951. https://doi.org/10.4236/ajps.2018.99140
Sirami, C., Gross, N., Baillod, A. B., Bertrand, C., Carrié, R., Hass, A., Henckel, L., Miguet, P., Vuillot, C., Alignier, A., Girard, J., Batáry, P., Clough, Y., Violle, C., Giralt, D., Bota, G., Badenhausser, I., Lefebvre, G., Gauffre, B., … Fahrig, L. (2019). Increasing crop heterogeneity enhances multitrophic diversity across agricultural regions. Proceedings of the National Academy of Sciences, 116(33), 16442–16447. https://doi.org/10.1073/pnas.1906419116
Spaeth, K., Weltz, M., Briske, D. D., Jolley, L. W., Metz, L. J., & Rossi, C. (2013). Rangeland CEAP: An assessment of natural resources conservation service practices. Rangelands, 35(1), 2–10. https://doi.org/10.2111/RANGELANDS-D-12-00040.1
Tamburini, G., Bommarco, R., Wanger, T. C., Kremen, C., Heijden, M. G. A. van der, Liebman, M., & Hallin, S. (2020). Agricultural diversification promotes multiple ecosystem services without compromising yield. Science Advances, 6(45), eaba1715. https://doi.org/10.1126/sciadv.aba1715
Tamburini, G., De Simone, S., Sigura, M., Boscutti, F., & Marini, L. (2016). Conservation tillage mitigates the negative effect of landscape simplification on biological control. Journal of Applied Ecology, 53(1), 233–241. https://doi.org/10.1111/1365-2664.12544
Tillman, P. G., Smith, H. A., & Holland, J. M. (2012). Cover crops and related methods for enhancing agricultural biodiversity and conservation biocontrol: Successful case studies (pp. 309–327). John Wiley & Sons, Ltd. https://doi.org/10.1002/9781118231838.ch19
Tscharntke, T., Tylianakis, J. M., Rand, T. A., Didham, R. K., Fahrig, L., Batáry, P., Bengtsson, J., Clough, Y., Crist, T. O., Dormann, C. F., Ewers, R. M., Fründ, J., Holt, R. D., Holzschuh, A., Klein, A. M., Kleijn, D., Kremen, C., Landis, D. A., Laurance, W., … Westphal, C. (2012). Landscape moderation of biodiversity patterns and processes - eight hypotheses. Biological Reviews, 87(3), 661–685. https://doi.org/10.1111/j.1469-185X.2011.00216.x
USDA NRCS. (2019). Pest management conservation system code 595 (ac) conservation practice standard. https://www.nrcs.usda.gov/resources/guides-and-instructions/pest-management-conservation-system-ac-595-conservation-practice
Usher, M. B. (1986). Wildlife conservation evaluation: Attributes, criteria and values (M. B. Usher, Ed.; pp. 3–44). Springer Netherlands. https://doi.org/10.1007/978-94-009-4091-8_1
VanBeek, K. R., Brawn, J. D., & Ward, M. P. (2014). Does no-till soybean farming provide any benefits for birds? Agriculture, Ecosystems & Environment, 185, 59–64. https://doi.org/10.1016/j.agee.2013.12.007
Warburton, D. B., & Klimstra, W. D. (1984). Wildlife use of netill and conventionally tilled corn fields. Journal of Soil and Water Conservation, 4.
West, A. S., Keyser, P. D., Lituma, C. M., Buehler, D. A., Applegate, R. D., & Morgan, J. (2016). Grasslands bird occupancy of native warm-season grass. The Journal of Wildlife Management, 80(6), 1081–1090. https://doi.org/10.1002/jwmg.21103
Whittaker, R. H. (1960). Vegetation of the siskiyou mountains, oregon and california. Ecological Monographs, 30(3), 279–338. https://doi.org/10.2307/1943563
Wilcoxen, C. A., Walk, J. W., & Ward, M. P. (2018). Use of cover crop fields by migratory and resident birds. Agriculture, Ecosystems & Environment, 252, 42–50. https://doi.org/10.1016/j.agee.2017.09.039
Zagorski, M. E., & Swihart, R. K. (2020). Killing time in cover crops? Artificial perches promote field use by raptors. Annals of Applied Biology, 177(3), 358–366. https://doi.org/10.1111/aab.12623